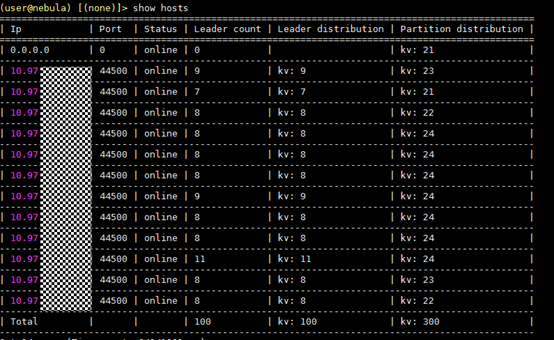
nebula 版本 1.0.0,用show hosts 查询 第一条显示 0.0.0.0 并且分配到partition,这是什么原因呢
你好,这个问题还能复现吗?
可以的,我重新部署集群和重新创建 space 都是这样,其他集群好像没有这个问题
storage conf ,不同节点只是修改了local ip
########## basics ##########
# Whether to run as a daemon process
--daemonize=true
# The file to host the process id
--pid_file=pids/nebula-storaged.pid

########## logging ##########
# The directory to host logging files, which must already exists
--log_dir=logs
# Log level, 0, 1, 2, 3 for INFO, WARNING, ERROR, FATAL respectively
--minloglevel=0
# Verbose log level, 1, 2, 3, 4, the higher of the level, the more verbose of the logging
--v=0
# Maximum seconds to buffer the log messages
--logbufsecs=0

########## networking ##########
# Meta server address
--meta_server_addrs=10.97.174.121:45500,10.97.174.163:45500,10.97.174.65:45500
# Local ip
--local_ip=10.97.174.121
# Storage daemon listening port
--port=44500
# HTTP service ip
--ws_ip=127.0.0.1
# HTTP service port
--ws_http_port=12000
# HTTP2 service port
--ws_h2_port=12002

######### Raft #########
## Raft election timeout
--raft_heartbeat_interval_secs=30
## RPC timeout for raft client (ms)
--raft_rpc_timeout_ms=5000
### recycle Raft WAL
--wal_ttl=14400

########## storage ##########
# Root data path, multiple paths should be splitted by comma.
# One path per instance, if --engine_type is `rocksdb'
--data_path=/opt/huawei/data1/nebula/data/storage,/opt/huawei/data2/nebula/data/storage,/opt/huawei/data3/nebula/data/storage,/opt/huawei/data4/nebula/data/storage

# The default reserved bytes for one batch operation
--rocksdb_batch_size=4096
# The default block cache size used in BlockBasedTable.
# The unit is MB.
--rocksdb_block_cache=614400
# The type of storage engine, `rocksdb', `memory', etc.
--engine_type=rocksdb

############## rocksdb Options ##############
--rocksdb_disable_wal=true
# rocksdb DBOptions in json, each name and value of option is a string, given as "option_name":"option_value" separated by comma
--rocksdb_db_options={"max_subcompactions":"10","max_background_jobs":"10"}
# rocksdb ColumnFamilyOptions in json, each name and value of option is string, given as "option_name":"option_value" separated by comma
--rocksdb_column_family_options={"disable_auto_compactions":"true","write_buffer_size":"67108864","max_write_buffer_number":"4","max_bytes_for_level_base":"268435456"}
# rocksdb BlockBasedTableOptions in json, each name and value of option is string, given as "option_name":"option_value" separated by comma
--rocksdb_block_based_table_options={"block_size":"8192"}
graph conf 区别也是 local ip不同
########## basics ##########
# Whether to run as a daemon process
--daemonize=true
# The file to host the process id
--pid_file=pids/nebula-graphd.pid

########## logging ##########
# The directory to host logging files, which must already exists
--log_dir=logs
# Log level, 0, 1, 2, 3 for INFO, WARNING, ERROR, FATAL respectively
--minloglevel=0
# Verbose log level, 1, 2, 3, 4, the higher of the level, the more verbose of the logging
--v=0
# Maximum seconds to buffer the log messages
--logbufsecs=0
# Whether to redirect stdout and stderr to separate output files
--redirect_stdout=true
# Destination filename of stdout and stderr, which will also reside in log_dir.
--stdout_log_file=stdout.log
--stderr_log_file=stderr.log
# Copy log messages at or above this level to stderr in addition to logfiles. The numbers of severity levels INFO, WARNING, ERROR, and FATAL are 0, 1, 2, and 3, respectively.
--stderrthreshold=2

########## networking ##########
# Meta Server Address
--meta_server_addrs=10.97.174.121:45500,10.97.174.163:45500,10.97.174.65:45500
# Local ip
--local_ip=10.97.174.121
# Network device to listen on
--listen_netdev=any
# Port to listen on
--port=3699
# To turn on SO_REUSEPORT or not
--reuse_port=false
# Backlog of the listen socket, adjust this together with net.core.somaxconn
--listen_backlog=1024
# Seconds before the idle connections are closed, 0 for never closed
--client_idle_timeout_secs=0
# Seconds before the idle sessions are expired, 0 for no expiration
--session_idle_timeout_secs=0
# The number of threads to accept incoming connections
--num_accept_threads=1
# The number of networking IO threads, 0 for # of CPU cores
--num_netio_threads=0
# The number of threads to execute user queries, 0 for # of CPU cores
--num_worker_threads=0
# HTTP service ip
--ws_ip=127.0.0.1
# HTTP service port
--ws_http_port=13000
# HTTP2 service port
--ws_h2_port=13002
# The default charset when a space is created
--default_charset=utf8
# The defaule collate when a space is created
--default_collate=utf8_bin

########## authorization ##########
# Enable authorization
--enable_authorize=false
meta conf
########## basics ##########
# Whether to run as a daemon process
--daemonize=true
# The file to host the process id
--pid_file=pids/nebula-metad.pid

########## logging ##########
# The directory to host logging files, which must already exists
--log_dir=logs
# Log level, 0, 1, 2, 3 for INFO, WARNING, ERROR, FATAL respectively
--minloglevel=0
# Verbose log level, 1, 2, 3, 4, the higher of the level, the more verbose of the logging
--v=0
# Maximum seconds to buffer the log messages
--logbufsecs=0

########## networking ##########
# Meta Server Address
--meta_server_addrs=10.97.174.121:45500,10.97.174.163:45500,10.97.174.65:45500
# Local ip
--local_ip=10.97.174.121
# Meta daemon listening port
--port=45500
# HTTP service ip
--ws_ip=127.0.0.1
# HTTP service port
--ws_http_port=11000
# HTTP2 service port
--ws_h2_port=11002

########## storage ##########
# Root data path, here should be only single path for metad
--data_path=/opt/huawei/data1/nebula/data/meta

########## Misc #########
# The default number of parts when a space is created
--default_parts_num=100
# The default replica factor when a space is created
--default_replica_factor=1
请问一下这个问题你有解决吗,我也是在输入 graphd 的 ws_ip 有问题,后来改成 0.0.0.0 好像就能跑了,但是我不太知道原因。。
1 个赞
ws_ip 设置成 0.0.0.0 后可以让其他机器访问该机器的端口,如果是设置成 127.0.0.1 应该是只能本机访问该 http 端口。
你这边也是碰到的 show partitions 的问题吗?