如果方案可行的话,记得回来更新下帖子进度哈 ^^ (方便给后来的用户提供一个参考答案)
ulimit -n 现在调整为 165535 ,然后刚才又出现 Too many open files 这个异常。
啥进程,开了这么多文件啊。du -h看下数据目录有多大
- storage进程。
- 报错的目录下有191G数据,3017个文件。
- 目前开启了自动compact, 但是已经很长时间没有进行全量compact,不清楚进行全量compact后会不会解决这个问题,先试一下。
对不上啊,才3000多个文件,ulimit 咋这么多呢
LOG文件也不应该会太多
根据前面的报错,才调整的ulimit数,目前不清楚rocksdb内部还有什么其它的操作,得先看一下代码了。 
可是linux文件就那么多,wal文件我记得是周期性会删除的,那就剩下sst文件和log文件了。。。
猜不出来了
如果外部请求量很大,是不是每次查询的时候都要进行文件打开关闭,然后导致文件打开太多报错?
不会的。
刚才查看系统日志发现storage 进程被系统kill 掉了
Feb  3 17:02:39 nebula-server-3 kernel: [24081]     0 24081 22753240  5908319   40218        0             0 nebula-graphd
Feb  3 17:02:39 nebula-server-3 kernel: [24302]     0 24302 30393122  9552041   54619        0             0 nebula-storaged
Feb  3 17:02:39 nebula-server-3 kernel: [24992]     0 24992    99162    10021     131        0             0 python3
Feb  3 17:02:39 nebula-server-3 kernel: [25011]     0 25011   108204    20397     138        0             0 python3
Feb  3 17:02:39 nebula-server-3 kernel: [12186]     0 12186   386163     3521      95        0             0 filebeat
Feb  3 17:02:39 nebula-server-3 kernel: Out of memory: Kill process 24302 (nebula-storaged) score 575 or sacrifice child
Feb  3 17:02:39 nebula-server-3 kernel: Killed process 24302 (nebula-storaged), UID 0, total-vm:121572488kB, anon-rss:38208164kB, file-rss:0kB, shmem-rss:0kB
Feb  3 17:02:39 nebula-server-3 kernel: filebeat invoked oom-killer: gfp_mask=0x201da, order=0, oom_score_adj=0
Feb  3 17:02:39 nebula-server-3 kernel: filebeat cpuset=/ mems_allowed=0
Feb  3 17:02:39 nebula-server-3 kernel: CPU: 12 PID: 12405 Comm: filebeat Tainted: G           OE  ------------ T 3.10.0-1062.12.1.el7.x86_64 #1
Feb  3 17:02:39 nebula-server-3 kernel: Hardware name: Alibaba Cloud Alibaba Cloud ECS, BIOS 8c24b4c 04/01/2014
Feb  3 17:02:39 nebula-server-3 kernel: Call Trace:
Feb  3 17:02:39 nebula-server-3 kernel: [<ffffffff8fb7ac43>] dump_stack+0x19/0x1b
Feb  3 17:02:39 nebula-server-3 kernel: [<ffffffff8fb75d09>] dump_header+0x90/0x229
Feb  3 17:02:39 nebula-server-3 kernel: [<ffffffff8f506152>] ? ktime_get_ts64+0x52/0xf0
Feb  3 17:02:39 nebula-server-3 kernel: [<ffffffff8f5c1734>] oom_kill_process+0x254/0x3e0
Feb  3 17:02:39 nebula-server-3 kernel: [<ffffffff8f532e81>] ? cpuset_mems_allowed_intersects+0x21/0x30
Feb  3 17:02:39 nebula-server-3 kernel: [<ffffffff8f5c11dd>] ? oom_unkillable_task+0xcd/0x120
Feb  3 17:02:39 nebula-server-3 kernel: [<ffffffff8f5c1286>] ? find_lock_task_mm+0x56/0xc0
Feb  3 17:02:39 nebula-server-3 kernel: [<ffffffff8f5c1f86>] out_of_memory+0x4b6/0x4f0
Feb  3 17:02:39 nebula-server-3 kernel: [<ffffffff8f5c8a8f>] __alloc_pages_nodemask+0xacf/0xbe0
Feb  3 17:02:39 nebula-server-3 kernel: [<ffffffff8f616ba8>] alloc_pages_current+0x98/0x110
Feb  3 17:02:39 nebula-server-3 kernel: [<ffffffff8f5bd637>] __page_cache_alloc+0x97/0xb0
这个是因为查询的时候数据加载很多导致的吗?
当前系统内存 64G,storage配置文件中的rocksdb_block_cache参数为
--rocksdb_block_cache=15360
能用运维工具如 tsar查一下历史机器的mem 使用情况吗
[root@nebula-server-3 tsar]# tsar --ndays 1
Time           ---cpu-- ---mem-- ---tcp-- -----traffic---- --vda--- --vda1-- --vdb---  ---load-
Time             util     util   retran    bytin  bytout     util     util     util     load1
03/02/21-18:10   5.06    60.11     0.02     2.2M    4.8M     0.01     0.01    40.43      1.21

MAX              5.06    60.11     0.02     2.2M    4.8M     0.01     0.01    40.43      1.21
MEAN             5.06    60.11     0.02     2.2M    4.8M     0.01     0.01    40.43      1.21
MIN              5.06    60.11     0.02     2.2M    4.8M     0.01     0.01    40.43      1.21
查询一下5min 间隔的数据,看一下出问题的时间段对应的mem
tsar -d 2 -i 5
[root@nebula-server-3 ~]# tsar -d 2 -i 5
Time           ---cpu-- ---mem-- ---tcp-- -----traffic---- --vda--- --vda1-- --vdb---  ---load-
Time             util     util   retran    bytin  bytout     util     util     util     load1
[root@nebula-server-3 ~]# tsar -n 2 -i 5
Time           ---cpu-- ---mem-- ---tcp-- -----traffic---- --vda--- --vda1-- --vdb---  ---load-
Time             util     util   retran    bytin  bytout     util     util     util     load1
03/02/21-18:10   5.06    60.11     0.02     2.2M    4.8M     0.01     0.01    40.43      1.21
03/02/21-18:15   3.90    60.10     0.02     2.1M    3.9M     0.04     0.04    36.17      1.38
03/02/21-18:20   4.45    60.82     0.01     2.6M    4.1M     0.02     0.02    36.15      0.83
03/02/21-18:25   4.38    60.15     0.02     2.3M    4.2M     0.02     0.02    37.02      1.01
03/02/21-18:30   4.55    60.15     0.04     2.1M    5.1M     0.01     0.01    32.84      0.95
03/02/21-18:35   4.38    60.52     0.02     2.0M    3.6M     0.01     0.01    33.79      1.24
03/02/21-18:40   3.71    60.06     0.03     1.9M    3.5M     0.01     0.01    31.50      0.86
03/02/21-18:45   3.69    60.23     0.03     2.4M    3.2M     0.01     0.01    31.36      1.18
03/02/21-18:50   3.70    61.57     0.02     2.5M    3.4M     0.01     0.01    31.89      1.09
03/02/21-18:55   3.49    60.10     0.01     1.7M    3.2M     0.02     0.02    33.36      0.35

MAX              5.06    61.57     0.02     2.6M    5.1M     0.01     0.01    40.43      1.38
MEAN             4.03    60.41     0.02     2.2M    3.8M     0.02     0.02    33.79      0.99
MIN              3.49    60.11     0.02     1.7M    3.2M     0.01     0.01    31.36      0.35
[root@nebula-server-3 ~]#
tsar 是我刚装的,是不是导致无法获取装之前的记录
那我这边也没法判断了,后面遇到这个问题 再用这个工具看看当时的mem
如果对这个几个进程做下保护让它不要被系统kill掉,应该能解决这个问题。
我建议 你们还是要注意峰值的qps ,不要把服务mem 打满 这样服务也会有问题的
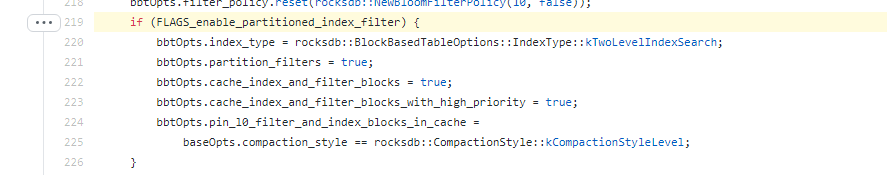
我不记得 partition index 那个rocksdb参数在1.0 有没有,把这个参数改为true。
是的