部署的是2.0的,三台机器,全部是通过rpm包的形式部署的,没有用docker
机器一
机器二
机器三
nebula-storage.conf
########## basics ##########
# Whether to run as a daemon process
--daemonize=true
# The file to host the process id
--pid_file=pids/nebula-storaged.pid
--local_config=true
########## logging ##########
# The directory to host logging files, which must already exists
--log_dir=logs
# Log level, 0, 1, 2, 3 for INFO, WARNING, ERROR, FATAL respectively
--minloglevel=0
# Verbose log level, 1, 2, 3, 4, the higher of the level, the more verbose of the logging
--v=0
# Maximum seconds to buffer the log messages
--logbufsecs=0
# Whether to redirect stdout and stderr to separate output files
--redirect_stdout=true
# Destination filename of stdout and stderr, which will also reside in log_dir.
--stdout_log_file=storaged-stdout.log
--stderr_log_file=storaged-stderr.log
# Copy log messages at or above this level to stderr in addition to logfiles. The numbers of severity levels INFO, WARNING, ERROR, and FATAL are 0, 1, 2, and 3, respectively.
--stderrthreshold=2
########## networking ##########
# Comma separated Meta server addresses
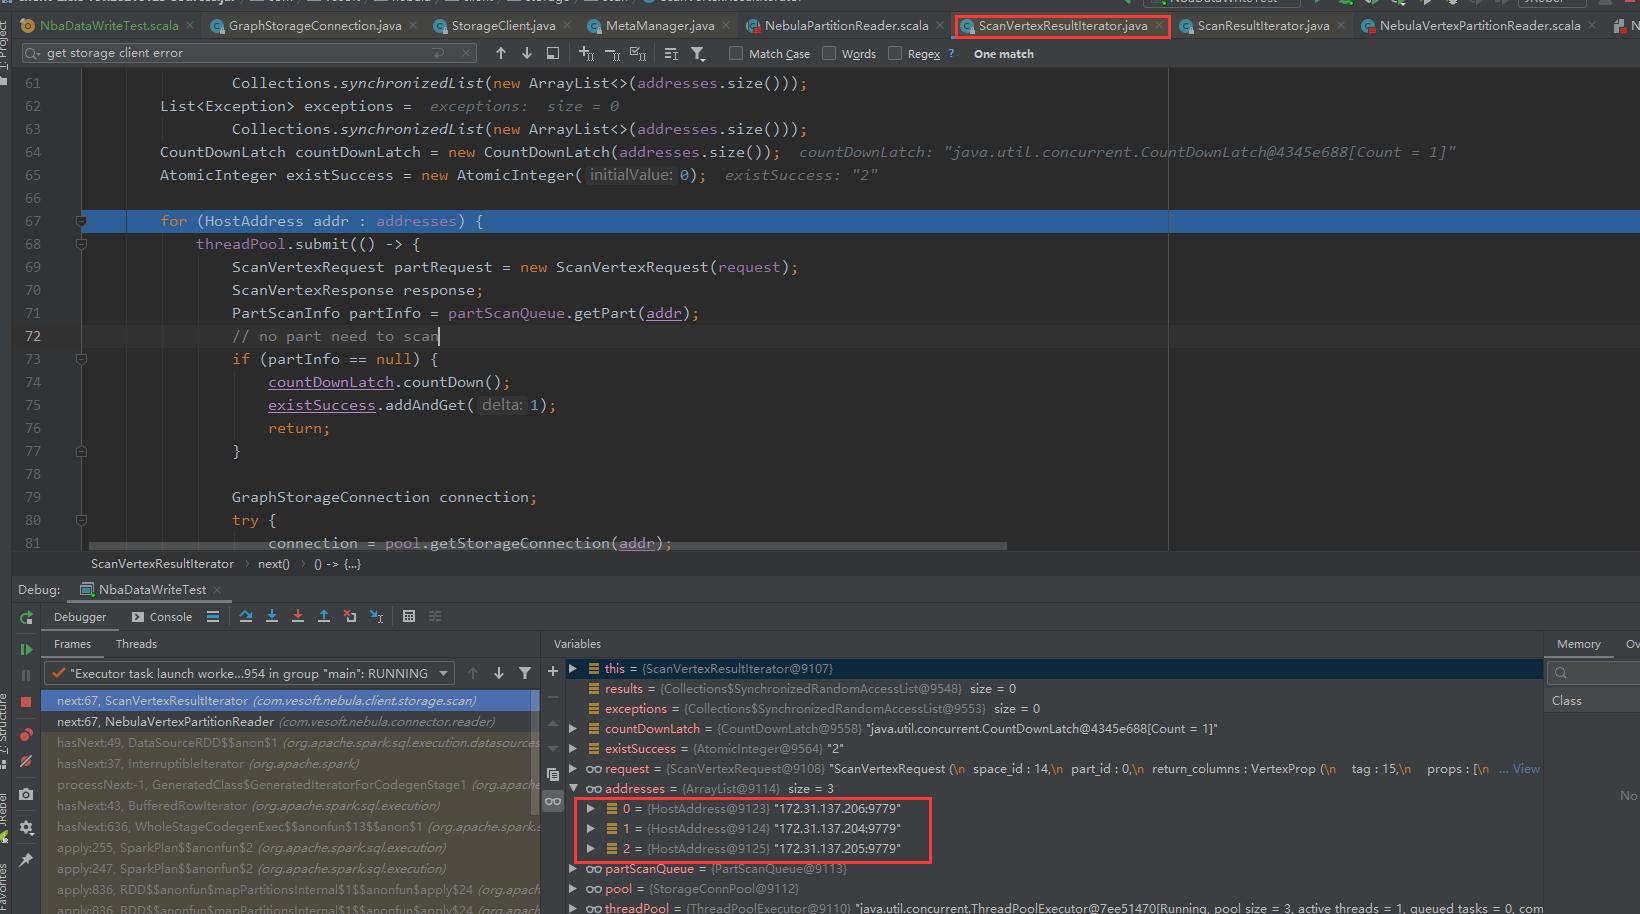
--meta_server_addrs=172.31.137.204:9559,172.31.137.205:9559,172.31.137.206:9559
# Local IP used to identify the nebula-storaged process.
# Change it to an address other than loopback if the service is distributed or
# will be accessed remotely.
--local_ip=172.31.137.206
# Storage daemon listening port
--port=9779
# HTTP service ip
--ws_ip=0.0.0.0
# HTTP service port
--ws_http_port=19779
# HTTP2 service port
--ws_h2_port=19780
# heartbeat with meta service
--heartbeat_interval_secs=10
######### Raft #########
# Raft election timeout
--raft_heartbeat_interval_secs=30
# RPC timeout for raft client (ms)
--raft_rpc_timeout_ms=500
## recycle Raft WAL
--wal_ttl=14400
########## Disk ##########
# Root data path. Split by comma. e.g. --data_path=/disk1/path1/,/disk2/path2/
# One path per Rocksdb instance.
--data_path=data/storage
# The default reserved bytes for one batch operation
--rocksdb_batch_size=4096
# The default block cache size used in BlockBasedTable.
# The unit is MB.
--rocksdb_block_cache=4
# The type of storage engine, `rocksdb', `memory', etc.
--engine_type=rocksdb
# Compression algorithm, options: no,snappy,lz4,lz4hc,zlib,bzip2,zstd
# For the sake of binary compatibility, the default value is snappy.
# Recommend to use:
# * lz4 to gain more CPU performance, with the same compression ratio with snappy
# * zstd to occupy less disk space
# * lz4hc for the read-heavy write-light scenario
--rocksdb_compression=lz4
# Set different compressions for different levels
# For example, if --rocksdb_compression is snappy,
# "no:no:lz4:lz4::zstd" is identical to "no:no:lz4:lz4:snappy:zstd:snappy"
# In order to disable compression for level 0/1, set it to "no:no"
--rocksdb_compression_per_level=
# Whether or not to enable rocksdb's statistics, disabled by default
--enable_rocksdb_statistics=false
# Statslevel used by rocksdb to collection statistics, optional values are
# * kExceptHistogramOrTimers, disable timer stats, and skip histogram stats
# * kExceptTimers, Skip timer stats
# * kExceptDetailedTimers, Collect all stats except time inside mutex lock AND time spent on compression.
# * kExceptTimeForMutex, Collect all stats except the counters requiring to get time inside the mutex lock.
# * kAll, Collect all stats
--rocksdb_stats_level=kExceptHistogramOrTimers
# Whether or not to enable rocksdb's prefix bloom filter, disabled by default.
--enable_rocksdb_prefix_filtering=false
# Whether or not to enable the whole key filtering.
--enable_rocksdb_whole_key_filtering=true
# The prefix length for each key to use as the filter value.
# can be 12 bytes(PartitionId + VertexID), or 16 bytes(PartitionId + VertexID + TagID/EdgeType).
--rocksdb_filtering_prefix_length=12
############## rocksdb Options ##############
# rocksdb DBOptions in json, each name and value of option is a string, given as "option_name":"option_value" separated by comma
--rocksdb_db_options={}
# rocksdb ColumnFamilyOptions in json, each name and value of option is string, given as "option_name":"option_value" separated by comma
--rocksdb_column_family_options={"write_buffer_size":"67108864","max_write_buffer_number":"4","max_bytes_for_level_base":"268435456"}
# rocksdb BlockBasedTableOptions in json, each name and value of option is string, given as "option_name":"option_value" separated by comma
--rocksdb_block_based_table_options={"block_size":"8192"}