Studio 版本:v2.1.9
nebula:v2.0.0
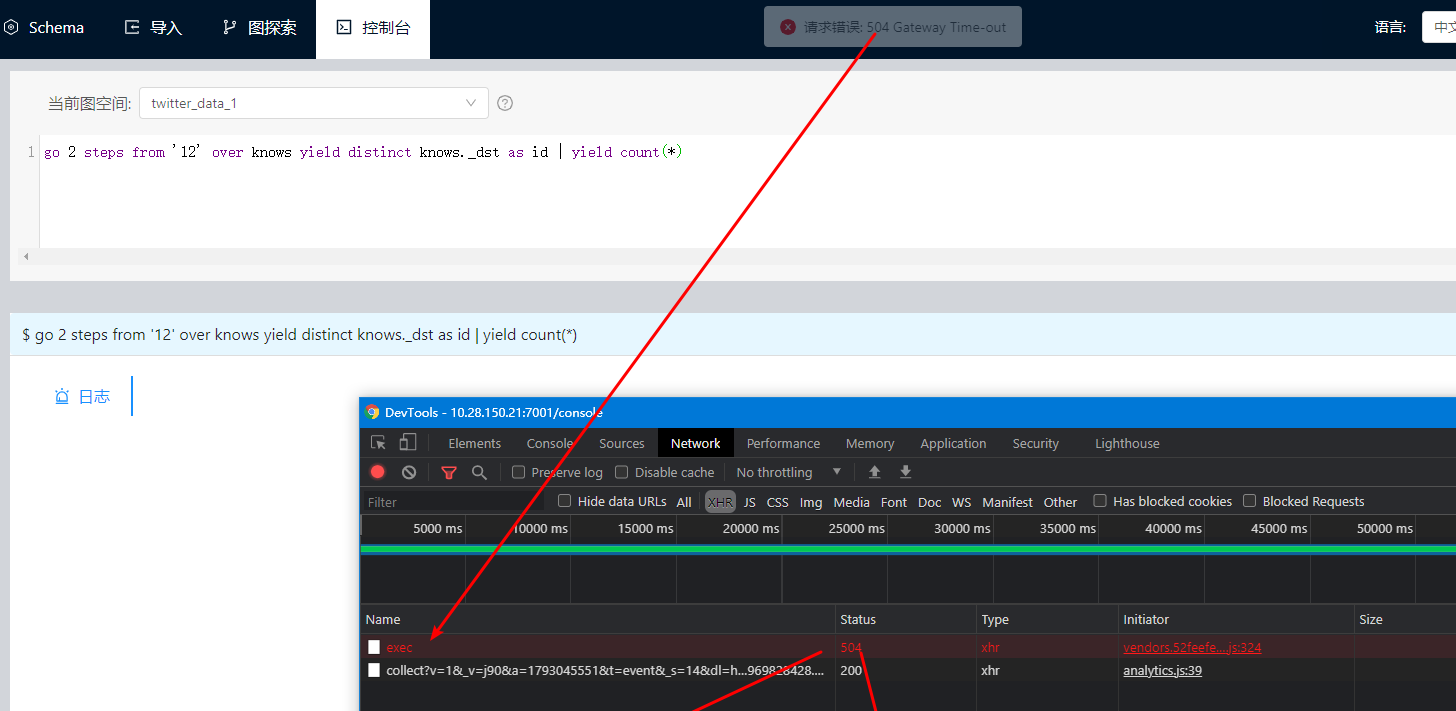
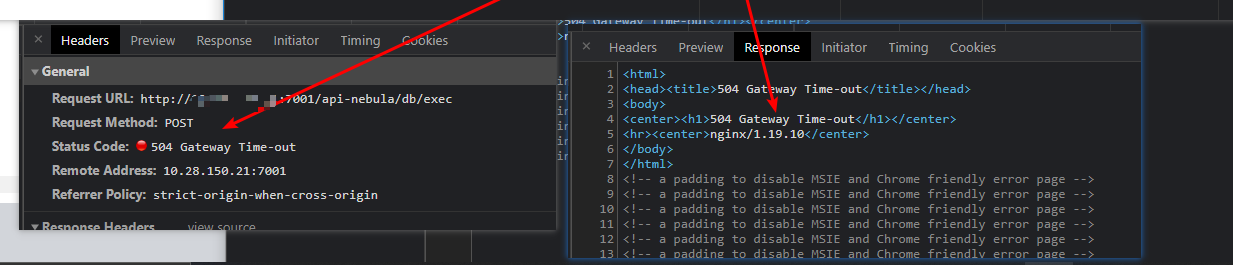
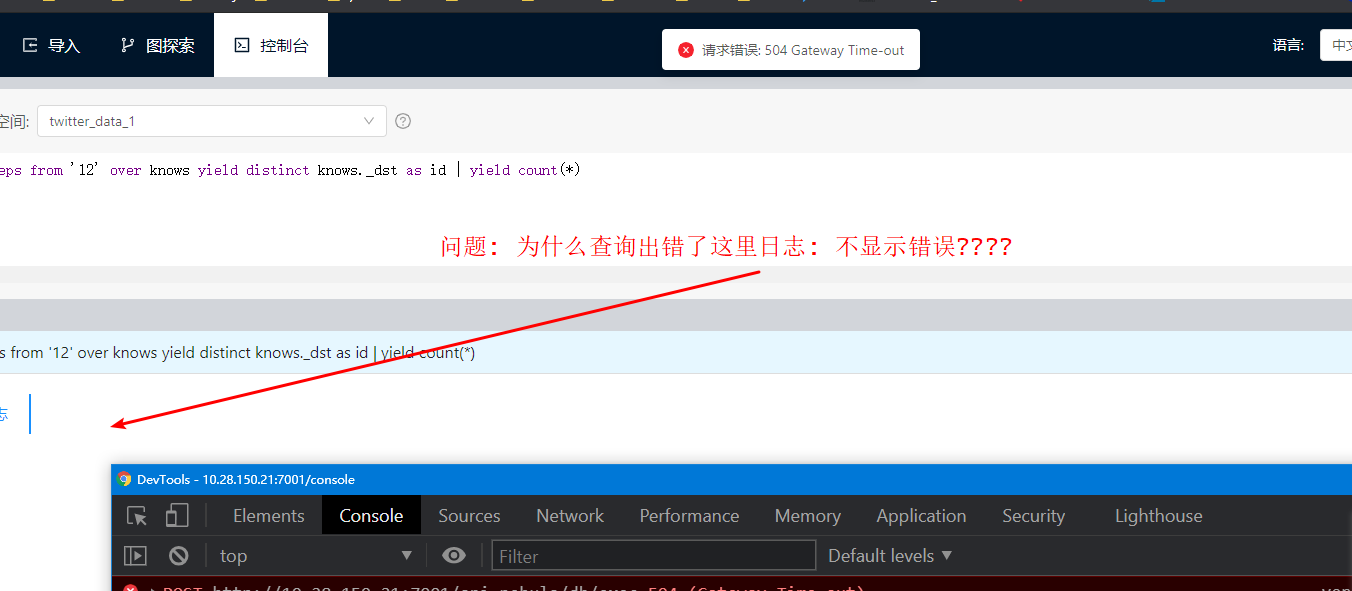
请问下, 使用studio -v2查询报504 是怎么回事呢? 对应的graph上也没有err日志…
graph 配置信息
########## basics ##########
# Whether to run as a daemon process
--daemonize=true
# The file to host the process id
--pid_file=pids/nebula-graphd.pid
# Whether to enable optimizer
--enable_optimizer=true

########## logging ##########
# The directory to host logging files, which must already exists
--log_dir=logs
# Log level, 0, 1, 2, 3 for INFO, WARNING, ERROR, FATAL respectively
--minloglevel=0
# Verbose log level, 1, 2, 3, 4, the higher of the level, the more verbose of the logging
--v=0
# Maximum seconds to buffer the log messages
--logbufsecs=0
# Whether to redirect stdout and stderr to separate output files
--redirect_stdout=true
# Destination filename of stdout and stderr, which will also reside in log_dir.
--stdout_log_file=graphd-stdout.log
--stderr_log_file=graphd-stderr.log
# Copy log messages at or above this level to stderr in addition to logfiles. The numbers of severity levels INFO, WARNING, ERROR, and FATAL are 0, 1, 2, and 3, respectively.
--stderrthreshold=2

########## query ##########
# Whether to treat partial success as an error.
# This flag is only used for Read-only access, and Modify access always treats partial success as an error.
--accept_partial_success=false

########## networking ##########
# Comma separated Meta Server Addresses
--meta_server_addrs=127.0.0.1:9559
# Local IP used to identify the nebula-graphd process.
# Change it to an address other than loopback if the service is distributed or
# will be accessed remotely.
--local_ip=127.0.0.1
# Network device to listen on
--listen_netdev=any
# Port to listen on
--port=9669
# To turn on SO_REUSEPORT or not
--reuse_port=false
# Backlog of the listen socket, adjust this together with net.core.somaxconn
--listen_backlog=1024
# Seconds before the idle connections are closed, 0 for never closed
--client_idle_timeout_secs=0
# Seconds before the idle sessions are expired, 0 for no expiration
--session_idle_timeout_secs=0
# The number of threads to accept incoming connections
--num_accept_threads=1
# The number of networking IO threads, 0 for # of CPU cores
--num_netio_threads=0
# The number of threads to execute user queries, 0 for # of CPU cores
--num_worker_threads=0
# HTTP service ip
--ws_ip=0.0.0.0
# HTTP service port
--ws_http_port=19669
# HTTP2 service port
--ws_h2_port=19670

# The default charset when a space is created
--default_charset=utf8
# The defaule collate when a space is created
--default_collate=utf8_bin

########## authorization ##########
# Enable authorization
--enable_authorize=false

########## Authentication ##########
# User login authentication type, password for nebula authentication, ldap for ldap authentication, cloud for cloud authentication
--auth_type=password

--storage_client_timeout_ms=300000
meta 配置信息
########## basics ##########
# Whether to run as a daemon process
--daemonize=true
# The file to host the process id
--pid_file=pids/nebula-metad.pid

########## logging ##########
# The directory to host logging files, which must already exists
--log_dir=logs
# Log level, 0, 1, 2, 3 for INFO, WARNING, ERROR, FATAL respectively
--minloglevel=0
# Verbose log level, 1, 2, 3, 4, the higher of the level, the more verbose of the logging
--v=0
# Maximum seconds to buffer the log messages
--logbufsecs=0
# Whether to redirect stdout and stderr to separate output files
--redirect_stdout=true
# Destination filename of stdout and stderr, which will also reside in log_dir.
--stdout_log_file=metad-stdout.log
--stderr_log_file=metad-stderr.log
# Copy log messages at or above this level to stderr in addition to logfiles. The numbers of severity levels INFO, WARNING, ERROR, and FATAL are 0, 1, 2, and 3, respectively.
--stderrthreshold=2

########## networking ##########
# Comma separated Meta Server addresses
--meta_server_addrs=127.0.0.1:9559
# Local IP used to identify the nebula-metad process.
# Change it to an address other than loopback if the service is distributed or
# will be accessed remotely.
--local_ip=127.0.0.1
# Meta daemon listening port
--port=9559
# HTTP service ip
--ws_ip=0.0.0.0
# HTTP service port
--ws_http_port=19559
# HTTP2 service port
--ws_h2_port=19560

########## storage ##########
# Root data path, here should be only single path for metad
--data_path=data/meta

########## Misc #########
# The default number of parts when a space is created
--default_parts_num=100
# The default replica factor when a space is created
--default_replica_factor=1

--heartbeat_interval_secs=10
storage 配置
########## basics ##########
# Whether to run as a daemon process
--daemonize=true
# The file to host the process id
--pid_file=pids/nebula-storaged.pid

########## logging ##########
# The directory to host logging files, which must already exists
--log_dir=logs
# Log level, 0, 1, 2, 3 for INFO, WARNING, ERROR, FATAL respectively
--minloglevel=0
# Verbose log level, 1, 2, 3, 4, the higher of the level, the more verbose of the logging
--v=0
# Maximum seconds to buffer the log messages
--logbufsecs=0
# Whether to redirect stdout and stderr to separate output files
--redirect_stdout=true
# Destination filename of stdout and stderr, which will also reside in log_dir.
--stdout_log_file=storaged-stdout.log
--stderr_log_file=storaged-stderr.log
# Copy log messages at or above this level to stderr in addition to logfiles. The numbers of severity levels INFO, WARNING, ERROR, and FATAL are 0, 1, 2, and 3, respectively.
--stderrthreshold=2

########## networking ##########
# Comma separated Meta server addresses
--meta_server_addrs=127.0.0.1:9559
# Local IP used to identify the nebula-storaged process.
# Change it to an address other than loopback if the service is distributed or
# will be accessed remotely.
--local_ip=127.0.0.1
# Storage daemon listening port
--port=9779
# HTTP service ip
--ws_ip=0.0.0.0
# HTTP service port
--ws_http_port=19779
# HTTP2 service port
--ws_h2_port=19780
# heartbeat with meta service
--heartbeat_interval_secs=10

######### Raft #########
# Raft election timeout
--raft_heartbeat_interval_secs=30
# RPC timeout for raft client (ms)
--raft_rpc_timeout_ms=500
## recycle Raft WAL
--wal_ttl=14400

########## Disk ##########
# Root data path. Split by comma. e.g. --data_path=/disk1/path1/,/disk2/path2/
# One path per Rocksdb instance.
--data_path=data/storage

# The default reserved bytes for one batch operation
--rocksdb_batch_size=4096
# The default block cache size used in BlockBasedTable.
# The unit is MB.
--rocksdb_block_cache=4
# The type of storage engine, `rocksdb', `memory', etc.
--engine_type=rocksdb

# Compression algorithm, options: no,snappy,lz4,lz4hc,zlib,bzip2,zstd
# For the sake of binary compatibility, the default value is snappy.
# Recommend to use:
#   * lz4 to gain more CPU performance, with the same compression ratio with snappy
#   * zstd to occupy less disk space
#   * lz4hc for the read-heavy write-light scenario
--rocksdb_compression=lz4

# Set different compressions for different levels
# For example, if --rocksdb_compression is snappy,
# "no:no:lz4:lz4::zstd" is identical to "no:no:lz4:lz4:snappy:zstd:snappy"
# In order to disable compression for level 0/1, set it to "no:no"
--rocksdb_compression_per_level=

# Whether or not to enable rocksdb's statistics, disabled by default
--enable_rocksdb_statistics=false

# Statslevel used by rocksdb to collection statistics, optional values are
#   * kExceptHistogramOrTimers, disable timer stats, and skip histogram stats
#   * kExceptTimers, Skip timer stats
#   * kExceptDetailedTimers, Collect all stats except time inside mutex lock AND time spent on compression.
#   * kExceptTimeForMutex, Collect all stats except the counters requiring to get time inside the mutex lock.
#   * kAll, Collect all stats
--rocksdb_stats_level=kExceptHistogramOrTimers

# Whether or not to enable rocksdb's prefix bloom filter, disabled by default.
--enable_rocksdb_prefix_filtering=false
# Whether or not to enable the whole key filtering.
--enable_rocksdb_whole_key_filtering=true
# The prefix length for each key to use as the filter value.
# can be 12 bytes(PartitionId + VertexID), or 16 bytes(PartitionId + VertexID + TagID/EdgeType).
--rocksdb_filtering_prefix_length=12

############## rocksdb Options ##############
# rocksdb DBOptions in json, each name and value of option is a string, given as "option_name":"option_value" separated by comma
--rocksdb_db_options={}
# rocksdb ColumnFamilyOptions in json, each name and value of option is string, given as "option_name":"option_value" separated by comma
--rocksdb_column_family_options={"write_buffer_size":"67108864","max_write_buffer_number":"4","max_bytes_for_level_base":"268435456"}
# rocksdb BlockBasedTableOptions in json, each name and value of option is string, given as "option_name":"option_value" separated by comma
--rocksdb_block_based_table_options={"block_size":"8192"}