- nebula 版本:nebula gragh 2.0 ga
- 部署方式:分布式
- 是否为线上版本:N
- 硬件信息
- 磁盘:HHD
GH-204:40G
GH-205:40G
GH-206:40G - CPU、内存信息
- 磁盘:HHD
- 问题的具体描述:
使用exchange 2.0 从hive中导入数据 到nebula
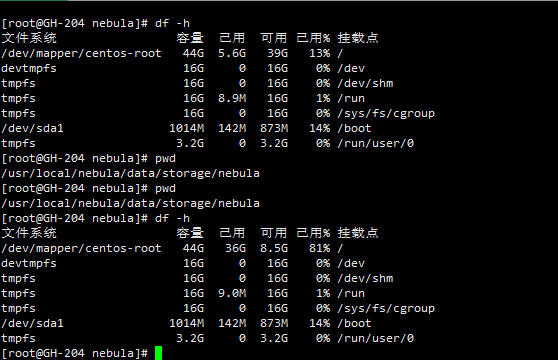
hive中原始数据大小 4.2 G , 3台 nebula 服务器合计使用 90G 磁盘空间
GH-204:
GH-205:

GH-206:

nebula space 创建:
   CREATE SPACE neb(partition_num=15, replica_factor=1, vid_type=fixed_string(800))
   CREATE TAG entity(name string)
exchange 配置:
        {
  # Spark relation config
  spark: {
    app: {
      name: Nebula Exchange 2.0
    }

    driver: {
      cores: 1
      maxResultSize: 4G
      memory: 4G
    }

    executor: {
        memory:6G
    }

    cores:{
      max: 10
    }
  }

  # if the hive is hive-on-spark with derby mode, you can ignore this hive configure
  # get the config values from file $HIVE_HOME/conf/hive-site.xml or hive-default.xml
    #hive: {
    #  waredir: "hdfs://act62.hadoop:8020/apps/hive/warehouse/"
    #  connectionURL: "jdbc:mysql://act62.hadoop:3306/hive?characterEncoding=UTF-8"
    #  connectionDriverName: "com.mysql.jdbc.Driver"
    #  connectionUserName: "hive"
    #  connectionPassword: "123456"
    #}

  # Nebula Graph relation config
  nebula: {
    address:{
      graph:["GH-204:9669","GH-205:9669","GH-206:9669"]
      meta:["GH-204:9559","GH-205:9559","GH-206:9559"]
    }
    user: user
    pswd: password
    space: neb

    # parameters for SST import, not required
    path:{
        local:"/tmp"
        remote:"/sst"
        hdfs.namenode: "hdfs://act62.hadoop:8020"
    }

    connection {
      timeout: 3000
      retry: 3
    }

    execution {
      retry: 3
    }

    error: {
      max: 32
      # failed import job will be recorded in output path
      output: /tmp/errors
    }

    rate: {
      limit: 1024
      timeout: 1000
    }
  }

  # Processing tags
  # There are tag config examples for different dataSources.
  tags: [


    # Hive
    {
      name: entity
      type: {
        source: hive
        sink: client
      }
      exec: "select vid,name from neb.entity"
      fields: [name]
      nebula.fields: [name]
      vertex: {
        field: vid
        # policy: "hash"
      }
      batch: 256
      partition: 32
    }

  ]

  # Processing edges
  # There are edge config examples for different dataSources.
 #edges: [
 #
 #  # Hive
 #  {
 #    name: follow
 #    type: {
 #      source: hive
 #      sink: client
 #    }
 #    exec: "select degree,b_id,e_id from neb.follow"
 #    fields: [ degree]
 #    nebula.fields: [degree]
 #    source: b_id
 #    target: e_id
 #    batch: 256
 #    partition: 32
 #  }
 #]
}