########## basics ##########
# Whether to run as a daemon process
--local_conf=true
--daemonize=true
# The file to host the process id
--pid_file=pids/nebula-graphd.pid
# Whether to enable optimizer
--enable_optimizer=true
########## logging ##########
# The directory to host logging files
--log_dir=logs
# Log level, 0, 1, 2, 3 for INFO, WARNING, ERROR, FATAL respectively
--minloglevel=0
# Verbose log level, 1, 2, 3, 4, the higher of the level, the more verbose of the logging
--v=0
# Maximum seconds to buffer the log messages
--logbufsecs=0
# Whether to redirect stdout and stderr to separate output files
--redirect_stdout=true
# Destination filename of stdout and stderr, which will also reside in log_dir.
--stdout_log_file=graphd-stdout.log
--stderr_log_file=graphd-stderr.log
# Copy log messages at or above this level to stderr in addition to logfiles. The numbers of severity levels INFO, WARNING, ERROR, and FATAL are 0, 1, 2, and 3, respectively.
--stderrthreshold=2
########## query ##########
# Whether to treat partial success as an error.
# This flag is only used for Read-only access, and Modify access always treats partial success as an error.
--accept_partial_success=false
########## networking ##########
# Comma separated Meta Server Addresses
--meta_server_addrs=172.19.208.25:9559,172.19.208.20:9559,172.19.208.42:9559
# Local IP used to identify the nebula-graphd process.
# Change it to an address other than loopback if the service is distributed or
# will be accessed remotely.
--local_ip=172.19.208.25
# Network device to listen on
--listen_netdev=any
# Port to listen on
--port=9669
# To turn on SO_REUSEPORT or not
--reuse_port=false
# Backlog of the listen socket, adjust this together with net.core.somaxconn
--listen_backlog=1024
# Seconds before the idle connections are closed, 0 for never closed
--client_idle_timeout_secs=0
# Seconds before the idle sessions are expired, 0 for no expiration
--session_idle_timeout_secs=0
# The number of threads to accept incoming connections
--num_accept_threads=1
# The number of networking IO threads, 0 for # of CPU cores
--num_netio_threads=0
# The number of threads to execute user queries, 0 for # of CPU cores
--num_worker_threads=4
# HTTP service ip
--ws_ip=172.19.208.25
# HTTP service port
--ws_http_port=19669
# HTTP2 service port
--ws_h2_port=19670
# The default charset when a space is created
--default_charset=utf8
# The defaule collate when a space is created
--default_collate=utf8_bin
########## authorization ##########
# Enable authorization
--enable_authorize=false
########## Authentication ##########
# User login authentication type, password for nebula authentication, ldap for ldap authentication, cloud for cloud authentication
--auth_type=password
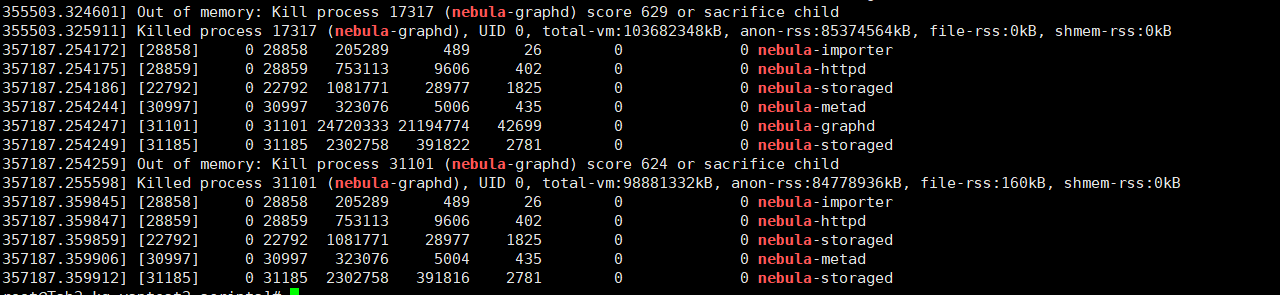
--system_memory_high_watermark_ratio = 1.0
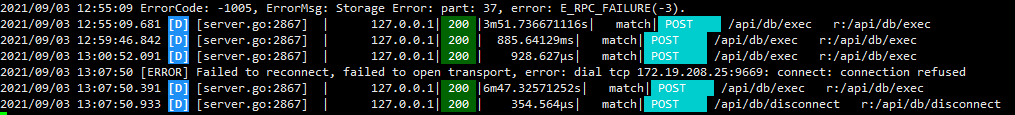
--storage_client_timeout_ms=60000
这个-local_config=true一直有配置,并且三台服务器均设置了1.0,并且 restart all