- nebula 版本:v2.6.1
- 部署方式:nebula-operator
- 安装方式:K8S
- 是否为线上版本:Y
- 硬件信息
- CPU、内存信息
- 问题的具体描述
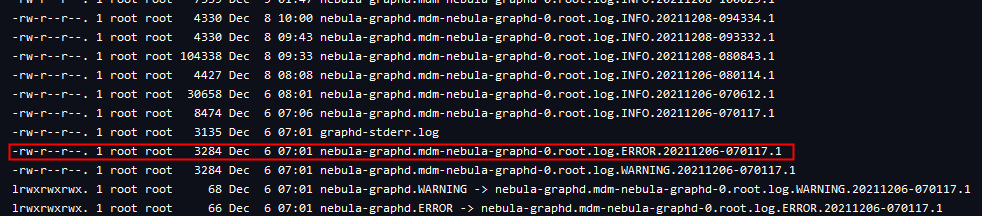
- 相关的 meta / storage / graph info 日志信息(尽量使用文本形式方便检索)
部分写入数据,有时候连续写入10W数据,100次写入记录都没问题,但是有时会突然写入失败
INFO[2021-12-06 15:12:47] /pb.GraphService/SyncNewSchemaData            err="<nil>" peer="170.18.9.200:21180" status=OK took_ns=14.781499ms user-agent="[grpc-python/1.33.2 grpc-c/13.0.0 (linux; chttp2)]"
INFO[2021-12-06 15:12:47] /pb.GraphService/SyncNewSchemaData            err="<nil>" peer="170.18.9.200:13259" status=OK took_ns=18.763531ms user-agent="[grpc-python/1.33.2 grpc-c/13.0.0 (linux; chttp2)]"
INFO[2021-12-06 15:12:47] /pb.GraphService/SyncNewSchemaData            err="<nil>" peer="170.18.9.200:18789" status=OK took_ns=17.779718ms user-agent="[grpc-python/1.33.2 grpc-c/13.0.0 (linux; chttp2)]"
INFO[2021-12-06 15:12:47] /pb.GraphService/SyncNewSchemaData            err="<nil>" peer="170.18.9.200:36441" status=OK took_ns=20.245243ms user-agent="[grpc-python/1.33.2 grpc-c/13.0.0 (linux; chttp2)]"
INFO[2021-12-06 15:12:47] /pb.GraphService/SyncNewSchemaData            err="<nil>" peer="170.18.9.200:37424" status=OK took_ns=18.627495ms user-agent="[grpc-python/1.33.2 grpc-c/13.0.0 (linux; chttp2)]"
INFO[2021-12-06 15:12:47] /pb.GraphService/SyncNewSchemaData            err="<nil>" peer="170.18.9.200:5625" status=OK took_ns=25.176534ms user-agent="[grpc-python/1.33.2 grpc-c/13.0.0 (linux; chttp2)]"
INFO[2021-12-06 15:12:47] /pb.GraphService/SyncNewSchemaData            err="<nil>" peer="170.18.9.200:44506" status=OK took_ns=21.07159ms user-agent="[grpc-python/1.33.2 grpc-c/13.0.0 (linux; chttp2)]"
INFO[2021-12-06 16:01:06] /pb.GraphService/SyncNewSchemaData            err="<nil>" peer="170.18.9.200:54318" status=OK took_ns=20.078816ms user-agent="[grpc-python/1.33.2 grpc-c/13.0.0 (linux; chttp2)]"
INFO[2021-12-06 16:01:06] /pb.GraphService/SyncNewSchemaData            err="<nil>" peer="170.18.9.200:29059" status=OK took_ns=19.695645ms user-agent="[grpc-python/1.33.2 grpc-c/13.0.0 (linux; chttp2)]"
INFO[2021-12-06 16:01:06] /pb.GraphService/SyncNewSchemaData            err="<nil>" peer="170.18.9.200:27381" status=OK took_ns=18.106921ms user-agent="[grpc-python/1.33.2 grpc-c/13.0.0 (linux; chttp2)]"
INFO[2021-12-06 16:01:06] /pb.GraphService/SyncNewSchemaData            err="<nil>" peer="170.18.9.200:6209" status=OK took_ns=17.49587ms user-agent="[grpc-python/1.33.2 grpc-c/13.0.0 (linux; chttp2)]"
INFO[2021-12-06 16:01:06] /pb.GraphService/SyncNewSchemaData            err="<nil>" peer="170.18.9.200:11548" status=OK took_ns=25.973524ms user-agent="[grpc-python/1.33.2 grpc-c/13.0.0 (linux; chttp2)]"
INFO[2021-12-06 16:01:06] /pb.GraphService/SyncNewSchemaData            err="<nil>" peer="170.18.9.200:48922" status=OK took_ns=16.251233ms user-agent="[grpc-python/1.33.2 grpc-c/13.0.0 (linux; chttp2)]"
INFO[2021-12-06 16:01:06] /pb.GraphService/SyncNewSchemaData            err="<nil>" peer="170.18.9.200:1986" status=OK took_ns=17.417241ms user-agent="[grpc-python/1.33.2 grpc-c/13.0.0 (linux; chttp2)]"
INFO[2021-12-06 16:01:06] /pb.GraphService/SyncNewSchemaData            err="<nil>" peer="170.18.9.200:60143" status=OK took_ns=17.027376ms user-agent="[grpc-python/1.33.2 grpc-c/13.0.0 (linux; chttp2)]"
INFO[2021-12-06 16:01:06] /pb.GraphService/SyncNewSchemaData            err="<nil>" peer="170.18.9.200:30840" status=OK took_ns=22.861761ms user-agent="[grpc-python/1.33.2 grpc-c/13.0.0 (linux; chttp2)]"
INFO[2021-12-06 16:01:06] /pb.GraphService/SyncNewSchemaData            err="<nil>" peer="170.18.9.200:46159" status=OK took_ns=15.116735ms user-agent="[grpc-python/1.33.2 grpc-c/13.0.0 (linux; chttp2)]"
INFO[2021-12-06 16:01:06] /pb.GraphService/SyncNewSchemaData            err="<nil>" peer="170.18.9.200:8077" status=OK took_ns=17.657854ms user-agent="[grpc-python/1.33.2 grpc-c/13.0.0 (linux; chttp2)]"
INFO[2021-12-06 16:01:06] /pb.GraphService/SyncNewSchemaData            err="<nil>" peer="170.18.9.200:49690" status=OK took_ns=15.406722ms user-agent="[grpc-python/1.33.2 grpc-c/13.0.0 (linux; chttp2)]"
INFO[2021-12-06 16:01:06] /pb.GraphService/SyncNewSchemaData            err="<nil>" peer="170.18.9.200:40085" status=OK took_ns=16.604359ms user-agent="[grpc-python/1.33.2 grpc-c/13.0.0 (linux; chttp2)]"
2021/12/06 16:01:09 [INFO] Successfully reconnect to host: 170.18.9.200, port: 31969
INFO[2021-12-06 16:01:09] /pb.GraphService/SyncNewSchemaData            err="<nil>" peer="170.18.9.200:22514" status=OK took_ns=3.182172427s user-agent="[grpc-python/1.33.2 grpc-c/13.0.0 (linux; chttp2)]"
INFO[2021-12-06 16:01:09] /pb.GraphService/SyncNewSchemaData            err="<nil>" peer="170.18.9.200:14238" status=OK took_ns=19.305098ms user-agent="[grpc-python/1.33.2 grpc-c/13.0.0 (linux; chttp2)]"
INFO[2021-12-06 16:01:09] /pb.GraphService/SyncNewSchemaData            err="<nil>" peer="170.18.9.200:36784" status=OK took_ns=16.681084ms user-agent="[grpc-python/1.33.2 grpc-c/13.0.0 (linux; chttp2)]"
INFO[2021-12-06 16:01:09] /pb.GraphService/SyncNewSchemaData            err="<nil>" peer="170.18.9.200:53993" status=OK took_ns=14.690944ms user-agent="[grpc-python/1.33.2 grpc-c/13.0.0 (linux; chttp2)]"
2021/12/06 16:01:13 [ERROR] Failed to reconnect, Failed to open transport, error: dial tcp 170.18.9.200:31969: connect: connection refused
ERRO[2021-12-06 16:01:13] graphservice_grpc.pb_impl.go:148 错误原因:Failed to open transport, error: dial tcp 170.18.9.200:31969: connect: connection refused
INFO[2021-12-06 16:01:13] /pb.GraphService/SyncNewSchemaData            err="<nil>" peer="170.18.9.200:62730" status=OK took_ns=3.390351866s user-agent="[grpc-python/1.33.2 grpc-c/13.0.0 (linux; chttp2)]"
Failed to open transport, error: dial tcp 170.18.9.200:31969: connect: connection refusedERRO[2021-12-06 16:01:13] /pb.GraphService/SyncNewSchemaData            err="rpc error: code = Internal desc = error is runtime error: invalid memory address or nil pointer dereference" peer="170.18.9.200:36651" status=KO took_ns=10.477364ms user-agent="[grpc-python/1.33.2 grpc-c/13.0.0 (linux; chttp2)]"
2021/12/08 16:08:32 [ERROR] Failed to reconnect, Failed to open transport, error: dial tcp 170.18.9.200:31969: connect: connection refused
ERRO[2021-12-08 16:08:32] graphservice_grpc.pb_impl.go:148 错误原因:Failed to open transport, error: dial tcp 170.18.9.200:31969: connect: connection refused
INFO[2021-12-08 16:08:32] /pb.GraphService/SyncNewSchemaData            err="<nil>" peer="170.18.9.200:56264" status=OK took_ns=4.694826314s user-agent="[grpc-python/1.33.2 grpc-c/13.0.0 (linux; chttp2)]"
Failed to open transport, error: dial tcp 170.18.9.200:31969: connect: connection refusedERRO[2021-12-08 16:08:32] /pb.GraphService/SyncNewSchemaData            err="rpc error: code = Internal desc = error is runtime error: invalid memory address or nil pointer dereference" peer="170.18.9.200:40679" status=KO took_ns=6.127708ms user-agent="[grpc-python/1.33.2 grpc-c/13.0.0 (linux; chttp2)]"
尝试过2.0版本,2.5.0和2.6.1版本,但是一直存在这种问题,我现在不确定哪里有问题,但倾向于代码问题,每次执行都去获取session执行
func Execute(gql string) (*nebula.ResultSet, error) {
	session, err := connectionPool.GetSession(username, password)
	if err != nil {
		fmt.Print(err.Error())
	}

	defer session.Release()

	resultSet, err := session.Execute(spaceDesc.UseSpaceString())
	if err != nil {
		fmt.Print(err.Error())
	}
	if !resultSet.IsSucceed() {
		fmt.Errorf("nebula使用空间%s失败", spaceDesc.Name)
	}

	resultSet, err = session.Execute(gql)
	return resultSet, err
}