嗯,已经找到问题。感谢
2 个赞
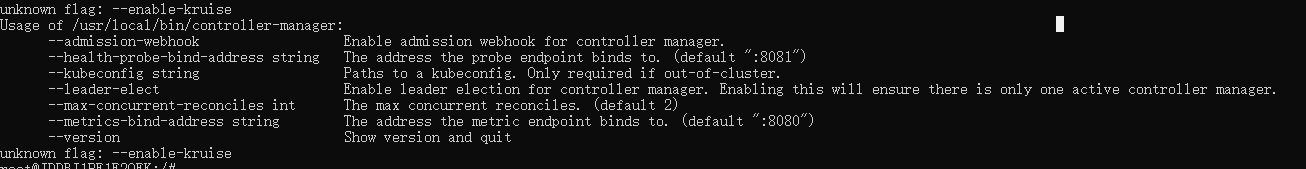
这个flag是默认关闭的,不会影响你启动operator服务的,你是怎么部署opeartor的,helm吗
是的,这个这个问题好像是解决了,我用0.8.0版本了。不过现在-controller-manager一直在CrashLoopBackOff和running之前来回切换
1 个赞

0.9.0你有运行过吗
有的。一开始从master上打包的,启动有有个flag不支持,我就换成0.8.0了,现在报上面图的错误
目前有修改的地方主要有以下两处
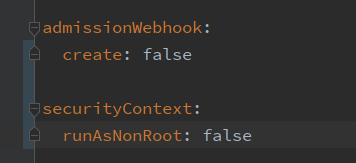
不知道是否有影响
我还是建议你用0.9.0的版本,这里面会依赖cert-manager,你按照步骤一步就可以安装上,然后helm install nebula-operator nebula-operator --repo https://vesoft-inc.github.io/nebula-operator/charts --version 0.9.0 --namespace=nebula-operator-system --create-namespace 就能启动operator了
admissionWebhook可以关闭,不会影响你安装部署的
1 个赞
您好,我现在已经完成了nebula-operator(0.9.0)和nebula-cluster在k8s上安装,目前安装的nebula库为2.6.2,接下来我需要安装nebula-stats-exporter,对nebula-cluster做对应的监控运维,是否有啥需要注意和参考提供呢?
前面@kqzh已经发过exporter的部署链接了,还是使用helm方式来安装,其他的就是prometheus,推荐你使用dashboard来监控,链接https://docs.nebula-graph.com.cn/2.5.1/nebula-dashboard/2.deploy-dashboard/
我现在就在看这个文档,但是我看这个node-exporter和prometheus,都说的很简单,比如我在同一个namespace下部署了nebula-cluster、nebula-stats-exporter,如果prometheus在别的namespace下,怎么能自动将nebula-stats-exporter的ip注册到prometheus里面呢?
1 个赞
spec:
  ...
  template:
    metadata:
      annotations:
        prometheus.io/path: /metrics
        prometheus.io/port: "9100"
        prometheus.io/scrape: "true"
      creationTimestamp: null
      labels:
        app: nebula-exporter
你需要在nebula-expporter上配置prometheus scrape的annotation,promethues会自动发现的
这个地方nebula-exporter用的端口是9100,node-exporter用的也是9100,这个会不会有冲突呢?
不会
这个annotations除了deployment里面需要加,service里面还需要加么?
不需要
好的。我先试试。谢谢
您好,prometheus对应的yaml文件有样例参考吗?