- nebula 版本: 3.2.1
- nebula-dashboard 版本:nebula-dashboard-3.1.0.x86_64
- 问题的具体描述
- 相关的 meta / storage / graph info 日志信息(尽量使用文本形式方便检索)
在分布式集群nebula中,共有6个节点,graphd * 6,metad * 5,storaged * 6,
nebula-dashboard 安装在其中1个节点,启动
启动服务
| 机器名称 | IP 地址 | node-exporter | nebula-stats-exporter | prometheus | nebula-http-gateway | dashboard |
|---|---|---|---|---|---|---|
| A | 110.110.200.52 | 1 | 1 | 1 | 1 | 1 |
| B | 110.110.200.53 | 1 | 0 | 0 | 0 | 0 |
| C | 110.110.200.54 | 1 | 0 | 0 | 0 | 0 |
| D | 122.30.240.11 | 1 | 0 | 0 | 0 | 0 |
| E | 122.30.240.12 | 1 | 0 | 0 | 0 | 0 |
| F | 122.30.240.13 | 1 | 0 | 0 | 0 | 0 |
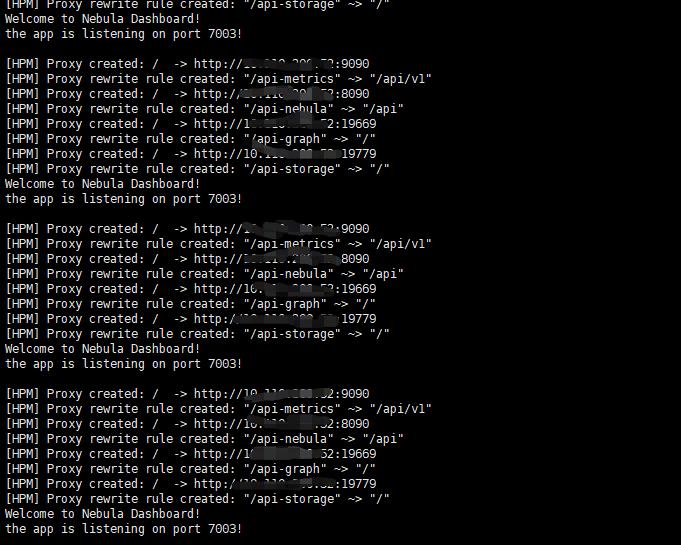
代码 / 终端输出 / 日志…
启动110.110.200.52 中的dashboard服务,几个小时后,服务宕掉