-
nebula 版本:2.0.01
-
部署方式:分布式
-
安装方式:源码编译
-
是否为线上版本:Y
-
硬件信息
3台机器
8C32G
ESSD云盘 3000G -
问题的具体描述
调度任务下午1点定时启动Spark任务全量读取图空间中的Edge,在2点左右将计算Vertex结果增量更新进Nebula。
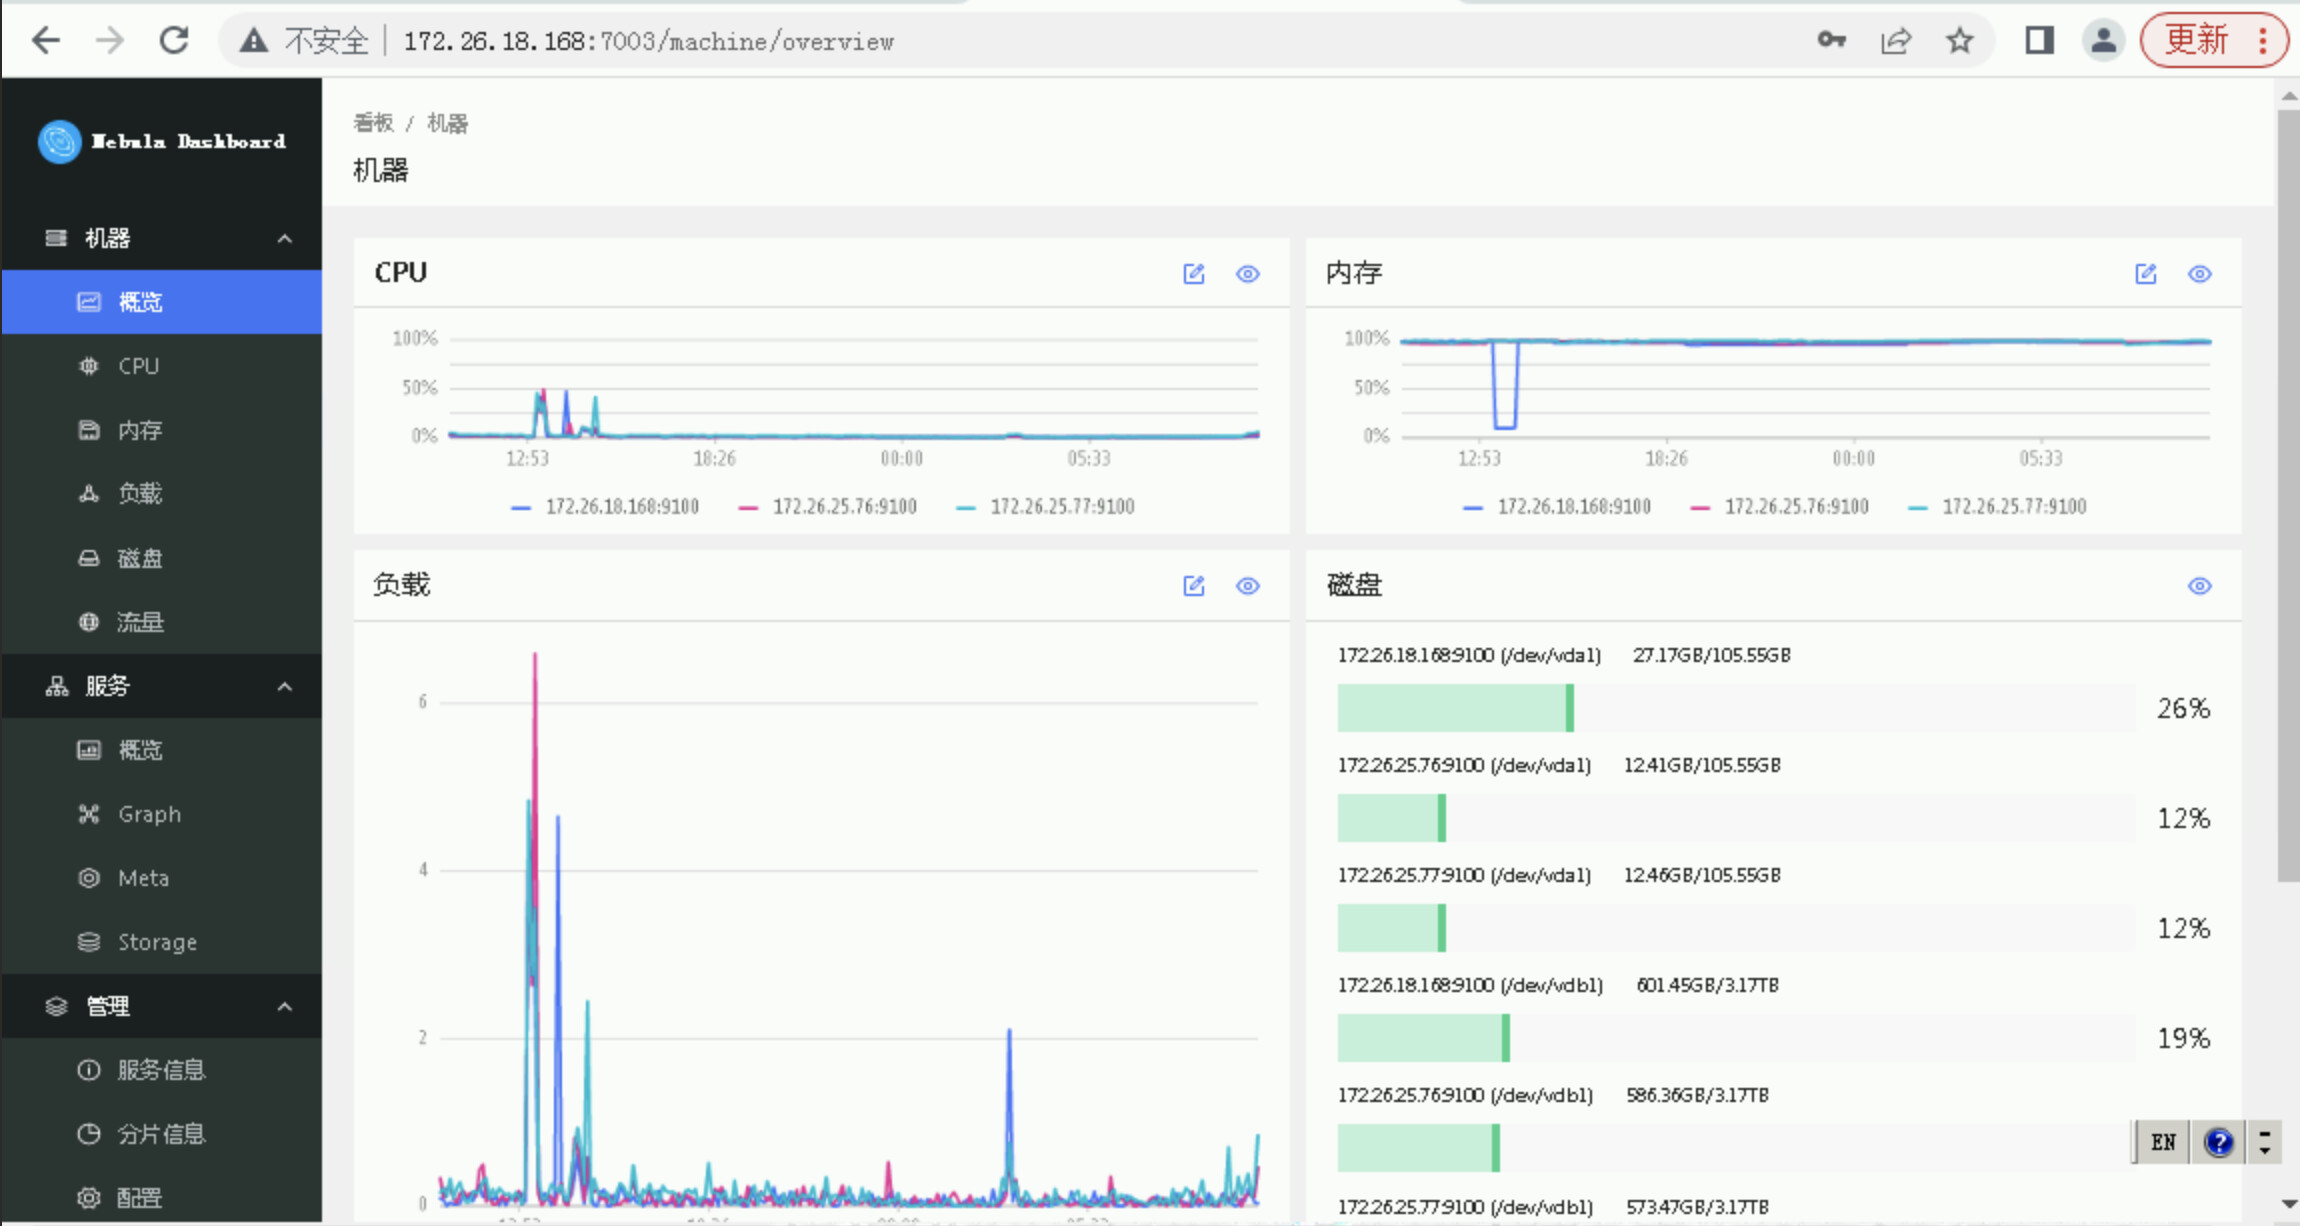
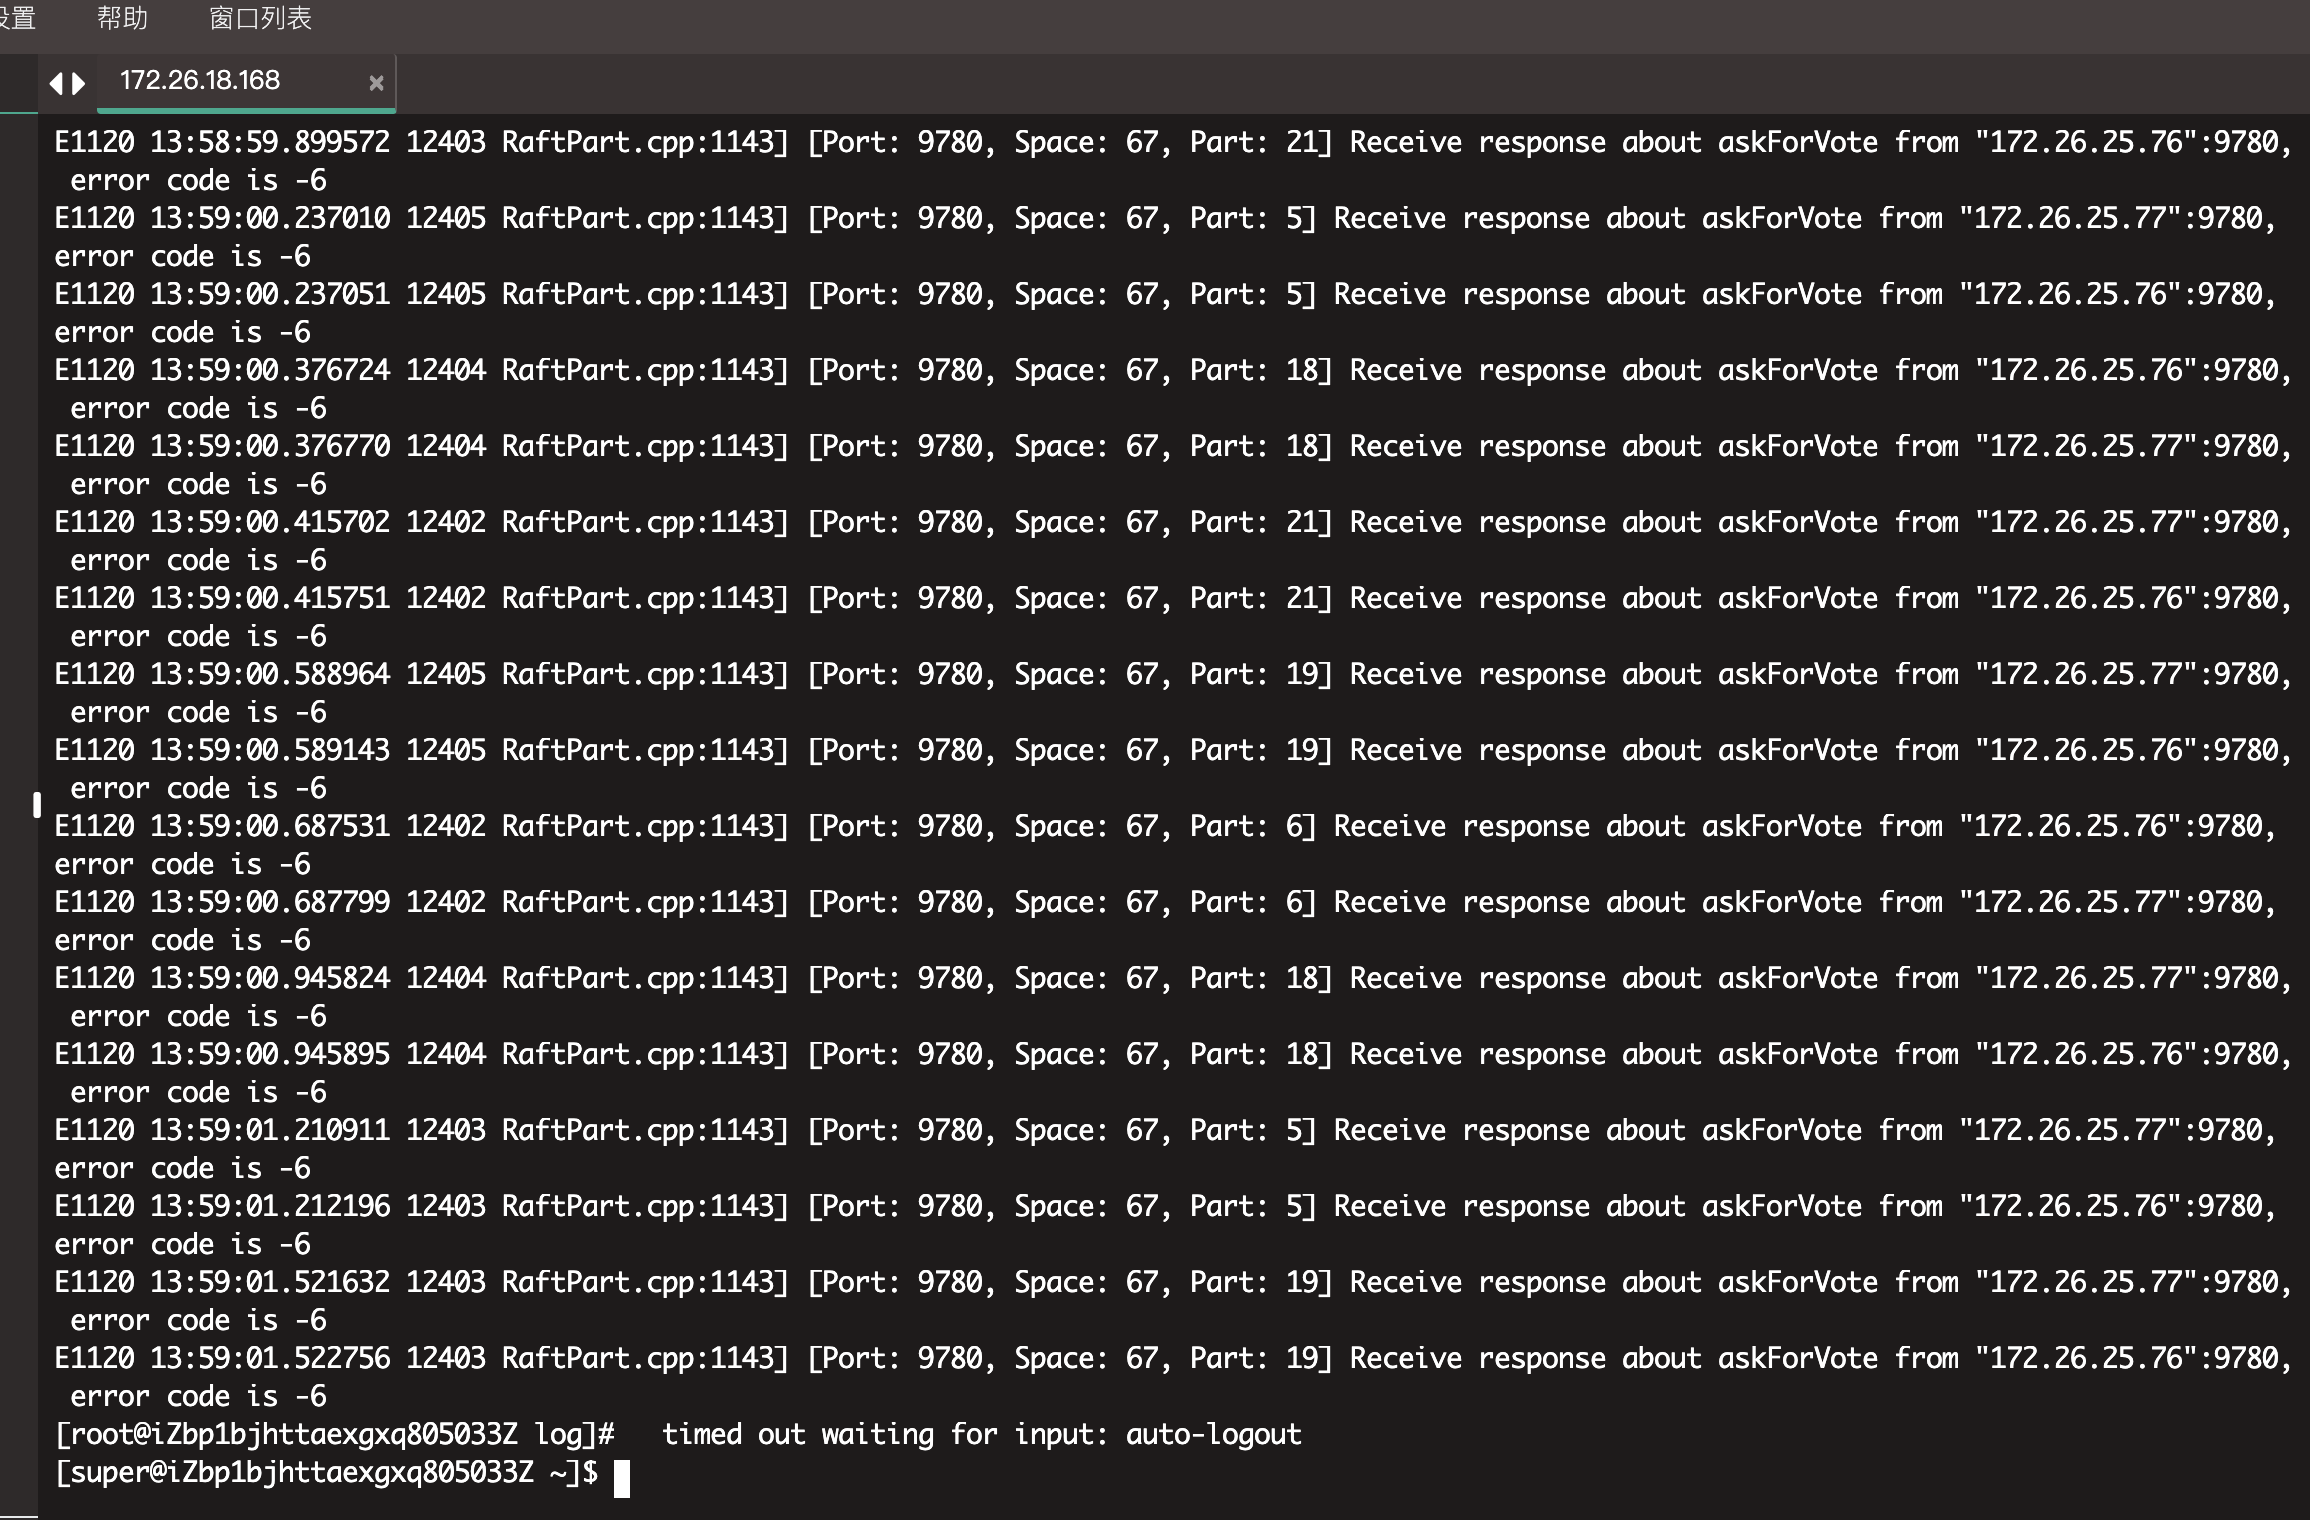
昨天下午1点10分发现线上Storaged 宕机,查询该节点Storaged ERROR日志 发现error_code (-6),同时进入nebula监控,发现内存使用率一直在98%左右徘徊。提问1:
Storaged宕机是否是由于内存OOM引起的? 是否有什么调优的方案。
提问2:
内存使用率98%是否正常?如不正常,有哪些可以排查和调优的方案。 -
相关的 meta / storage / graph info 日志信息(尽量使用文本形式方便检索)
能贴一下 storaged 的配置文件吗?
########## basics ##########

Whether to run as a daemon process
–daemonize=true

The file to host the process id
–pid_file=pids/nebula-storaged.pid

add by zengli to confirm timezone
–timezone_name=CST-8

########## logging ##########

The directory to host logging files
–log_dir=/alidata1/nebula-graph2/log

Log level, 0, 1, 2, 3 for INFO, WARNING, ERROR, FATAL respectively
–minloglevel=0

Verbose log level, 1, 2, 3, 4, the higher of the level, the more verbose of the logging
–v=0

Maximum seconds to buffer the log messages
–logbufsecs=0

Whether to redirect stdout and stderr to separate output files
–redirect_stdout=true

Destination filename of stdout and stderr, which will also reside in log_dir.
–stdout_log_file=storaged-stdout.log
–stderr_log_file=storaged-stderr.log

Copy log messages at or above this level to stderr in addition to logfiles. The numbers of severity levels INFO, WARNING, ERROR, and FATAL are 0, 1, 2, and 3, respectively.
–stderrthreshold=2

########## networking ##########

Comma separated Meta server addresses
–meta_server_addrs=172.26.18.168:9559,172.26.25.76:9559,172.26.25.77:9559

Local IP used to identify the nebula-storaged process.
Change it to an address other than loopback if the service is distributed or
will be accessed remotely.
–local_ip=172.26.18.168

Storage daemon listening port
–port=9779

HTTP service ip
–ws_ip=172.26.18.168

HTTP service port
–ws_http_port=19779

HTTP2 service port
–ws_h2_port=19780

heartbeat with meta service
–heartbeat_interval_secs=60

######### Raft #########

Raft election timeout
–raft_heartbeat_interval_secs=30

RPC timeout for raft client (ms)
–raft_rpc_timeout_ms=500

recycle Raft WAL
–wal_ttl=14400

########## Disk ##########

Root data path. Split by comma. e.g. --data_path=/disk1/path1/,/disk2/path2/
One path per Rocksdb instance.
–data_path=/alidata1/nebula-graph2/storage

The default reserved bytes for one batch operation
–rocksdb_batch_size=4096

The default block cache size used in BlockBasedTable.
The unit is MB.
–rocksdb_block_cache=4

The type of storage engine, rocksdb', memory’, etc.
–engine_type=rocksdb

Compression algorithm, options: no,snappy,lz4,lz4hc,zlib,bzip2,zstd
For the sake of binary compatibility, the default value is snappy.
Recommend to use:
* lz4 to gain more CPU performance, with the same compression ratio with snappy
* zstd to occupy less disk space
* lz4hc for the read-heavy write-light scenario
–rocksdb_compression=lz4

Set different compressions for different levels
For example, if --rocksdb_compression is snappy,
“no:no:lz4:lz4::zstd” is identical to “no:no:lz4:lz4:snappy:zstd:snappy”
In order to disable compression for level 0/1, set it to “no:no”
–rocksdb_compression_per_level=

Whether or not to enable rocksdb’s statistics, disabled by default
–enable_rocksdb_statistics=false

Statslevel used by rocksdb to collection statistics, optional values are
* kExceptHistogramOrTimers, disable timer stats, and skip histogram stats
* kExceptTimers, Skip timer stats
* kExceptDetailedTimers, Collect all stats except time inside mutex lock AND time spent on compression.
* kExceptTimeForMutex, Collect all stats except the counters requiring to get time inside the mutex lock.
* kAll, Collect all stats
–rocksdb_stats_level=kExceptHistogramOrTimers

Whether or not to enable rocksdb’s prefix bloom filter, disabled by default.
–enable_rocksdb_prefix_filtering=false

Whether or not to enable the whole key filtering.
–enable_rocksdb_whole_key_filtering=true

The prefix length for each key to use as the filter value.
can be 12 bytes(PartitionId + VertexID), or 16 bytes(PartitionId + VertexID + TagID/EdgeType).
–rocksdb_filtering_prefix_length=12

############## rocksdb Options ##############

rocksdb DBOptions in json, each name and value of option is a string, given as “option_name”:“option_value” separated by comma
–rocksdb_db_options={}

rocksdb ColumnFamilyOptions in json, each name and value of option is string, given as “option_name”:“option_value” separated by comma
–rocksdb_column_family_options={“disable_auto_compactions”:“false”,“write_buffer_size”:“67108864”,“max_write_buffer_number”:“4”,“max_bytes_for_level_base”:“268435456”}

rocksdb BlockBasedTableOptions in json, each name and value of option is string, given as “option_name”:“option_value” separated by comma
–rocksdb_block_based_table_options={“block_size”:“8192”}
不太好说原因一定在哪里。需要了解下背景:你们的场景读多还是写多?
你可以试着调几个选项:
- 如果写多,可以把自动 compaction 关掉,然后定时手动 compaction:disable_auto_compactions: true 。此外,可以看看各个 partition 的 leader 是不是均匀分布在各个机器上。
- 如果读多,看看是不是 cache 给的不够。
我们现在有3个主要的大场景使用Nebula。
- 每天下午1点从一个图空间里全量读边数据,然后计算好将增量数据更新回图里。
- 实时监听业务库表,识别出数据实时写入图里。
- 特征服务实时调用查询图。QPS 60左右。
感觉读和写都比较多。

另外我看了下leader 分布看起来不太均匀,需要手动rebalance一下嘛,rebalance完之后会不会有所改善?
balance 之后对写肯定会有所改善~
那内存使用率一直在98%左右徘徊,是否正常呢?
猜测是 rocksdb 的各种 cache 比较多,如何对 rocksdb 进行调优,可以多去查查,针对不同业务场景需要配置很多参数,这个就比较细节了。rocksdb 常用的 cache 有:
- 数据 block 的 cache
- index 和 filter 的 cache。
可以看看 enable_partitioned_index_filter
有没有具体的入口,我去看看哈
论坛上可以搜 OOM 相关,会有一些帖子;其他的就是去看 rocksdb 官方博客,比如 http://rocksdb.org/blog/2017/05/12/partitioned-index-filter.html ,或者去网上搜一搜了
好的,谢谢
此话题已在最后回复的 30 天后被自动关闭。不再允许新回复。