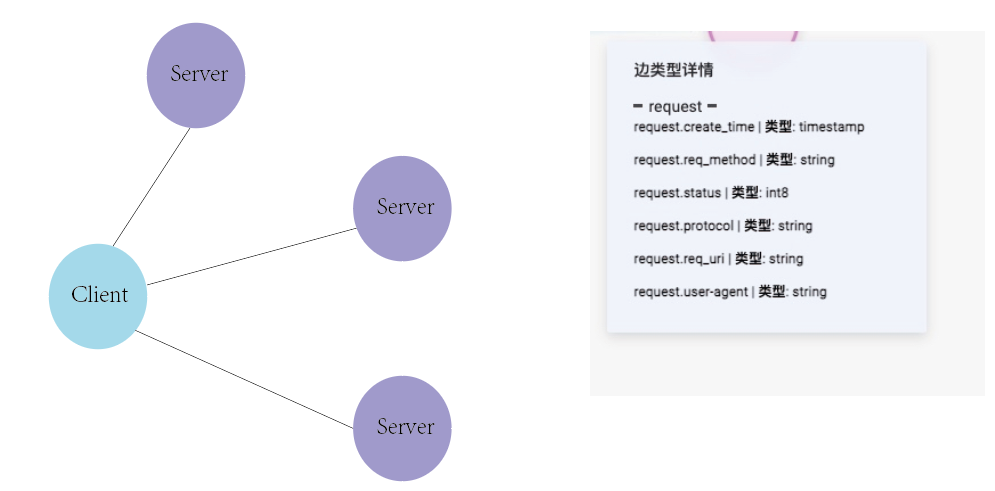
有一个schema,Client访问server,边的属性如图所示。
我想统计某个时间范围内,client对于server的出度,比如client在5分钟内有200次访问,也就是200条边,但是只访问了10种服务,应该要怎么统计?
目前设计的schema,一次访问就是一条边,好像没法做去重?
是不是多次插入变成了覆盖的情况?是的话,把 timestamp 放到 rank 上,能体现出来更多。
还是?
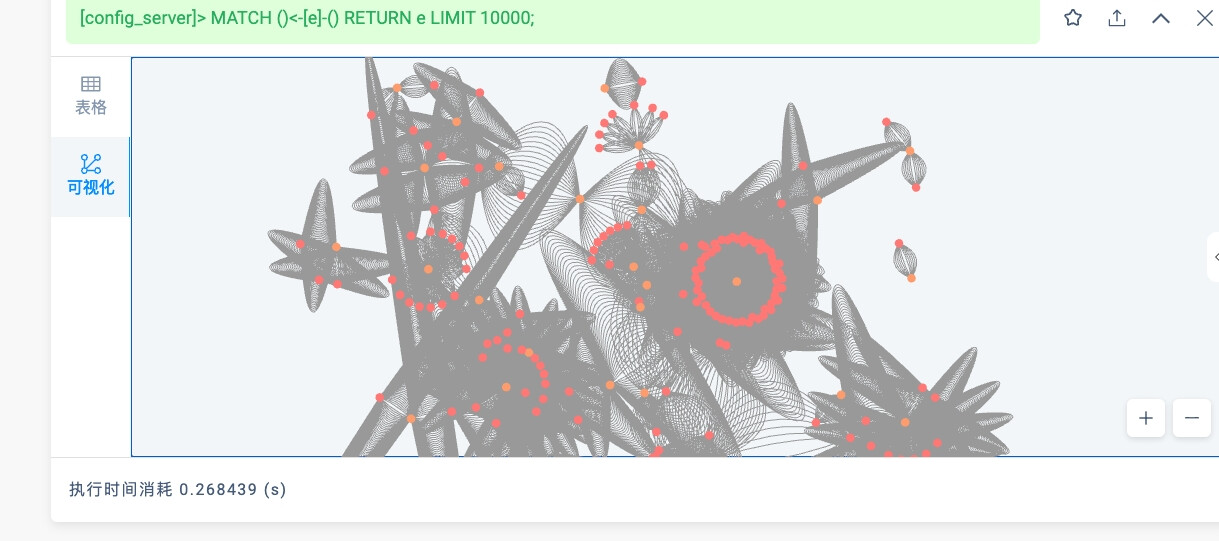
ps,原来点见边多的情况渲染出来挺好看的
插入的时候rank是timestam。
该schema的构建的思路是这样:
每条HTTP访问行为都是一条边,描述了某个ip → server的访问记录。
我想做这样一个分析,分析某个时间范围内,ip访问了多少种服务(理解为client到server的出度)
这样的话,现在这个图好像目前的边表示访问了多少次,请问这个schema该怎么构建,还是使用ngql,ngql有去重吗
当然可以,直接用 GO 就可以 GROUP BY/ 带 Count 的聚合
看了一下go的语法,要求有一个起始点,如果我是想遍历全部的client点,还能适用吗?
这是图分析场景(不是典型的图查询,从确定的一个多个起点出发),查询不一定适合(大数据量用 nebula-spark 扫全图写逻辑可以)。
用查询的话,可以的,不过如果是全图分析,数据量大的话可能会会炸内存
- lookup (需要索引)查出来所有,然后管道接 GO
- match去表达
应该是图分析场景,去分析tag为client在某个rank范围内访问了多少种tag为server的点,应该怎么做合适
参考一下
我尝试了使用nebula-algorithm实现自定义算法
/* Copyright (c) 2021 vesoft inc. All rights reserved.
 *
 * This source code is licensed under Apache 2.0 License.
 */

package com.vesoft.nebula.algorithm.lib

import com.vesoft.nebula.algorithm.config.{AlgoConstants, ConfigServerStaticConfig, DegreeStaticConfig}
import com.vesoft.nebula.algorithm.utils.{DecodeUtil, NebulaUtil}
import org.apache.log4j.Logger
import org.apache.spark.graphx.{Graph, VertexRDD}
import org.apache.spark.rdd.RDD
import org.apache.spark.sql.types.{IntegerType, LongType, StringType, StructField, StructType}
import org.apache.spark.sql.{DataFrame, Dataset, Row, SparkSession}

object ConfigServerStaticAlgo {

  private val LOGGER = Logger.getLogger(this.getClass)
  /**
   * run the pagerank algorithm for nebula graph
   */
  def apply(spark: SparkSession,
            dataset: Dataset[Row],
            configServerConfig:ConfigServerStaticConfig): DataFrame = {
    var encodeIdDf: DataFrame = null

    val graph: Graph[None.type, Long] = if (configServerConfig.encodeId) {
      val (data, encodeId) = DecodeUtil.convertStringId2LongId(dataset, false)
      encodeIdDf = encodeId
      NebulaUtil.loadInitLongGraph(data, true)
    } else {
      NebulaUtil.loadInitLongGraph(dataset, true)
    }
    val filteredGraph = graph.subgraph(edge => edge.attr >= configServerConfig.startTime && edge.attr <= configServerConfig.endTime)
    val configServerResultRDD = execute(spark,filteredGraph)

    val schema = StructType(
      List(
        StructField("src_id", LongType, nullable = false),
        StructField("request_unique_server_count", IntegerType, nullable = false)
      ))
    val algoResult = spark.sqlContext.createDataFrame(configServerResultRDD, schema)

    if (configServerConfig.encodeId) {
      DecodeUtil.convertAlgoId2StringId(algoResult, encodeIdDf)
    } else {
      algoResult
    }
  }

  def execute(spark: SparkSession,graph: Graph[None.type, Long]): RDD[Row] = {
    val result = graph.aggregateMessages[Set[Any]](
      triplet => {
        triplet.sendToSrc(Set(triplet.dstId))
      },
      (a, b) => a.union(b)
    ).collectAsMap()
    val rdd = spark.sparkContext.parallelize(result.toList.map { case (vertex, set) =>
      Row(vertex, set.size)
    })
    rdd
  }

}
思路是
通过spark先读取所有的边,然后通过startTime和endTime在graphX里抽取出一个subgraph,最后实现一个group by的操作进行统计
请问这样的实现方法和在使用ngql通过time进行match过滤读取边(相当于子图),哪个效率更高?
![]() 所以你测试出结果了么?哪个效果更高一点?
所以你测试出结果了么?哪个效果更高一点?