- nebula 版本:3.6
- 部署方式:单机
- 安装方式:RPM
- 是否上生产环境: N
- 硬件信息
- 内存 256G
- 问题的具体描述
一开始创建了一个没有索引的查询语句,可能因为数据量大给graph打崩了
语句
match(u:user)-[e]-(d:device) where d.device_id = "xxxx"
日志
E20231213 09:45:45.807657 492115 QueryInstance.cpp:151] SyntaxError: syntax error near `= "A6B33', query: match(d:device) where d.device.device_id = "xxxx" return d
E20231213 09:46:05.640084 492073 OptimizerUtils.cpp:557] No index was found
E20231213 09:46:05.640122 492073 OptimizerUtils.cpp:683] No valid index found
E20231213 09:46:05.640131 492073 OptimizerUtils.cpp:557] No index was found
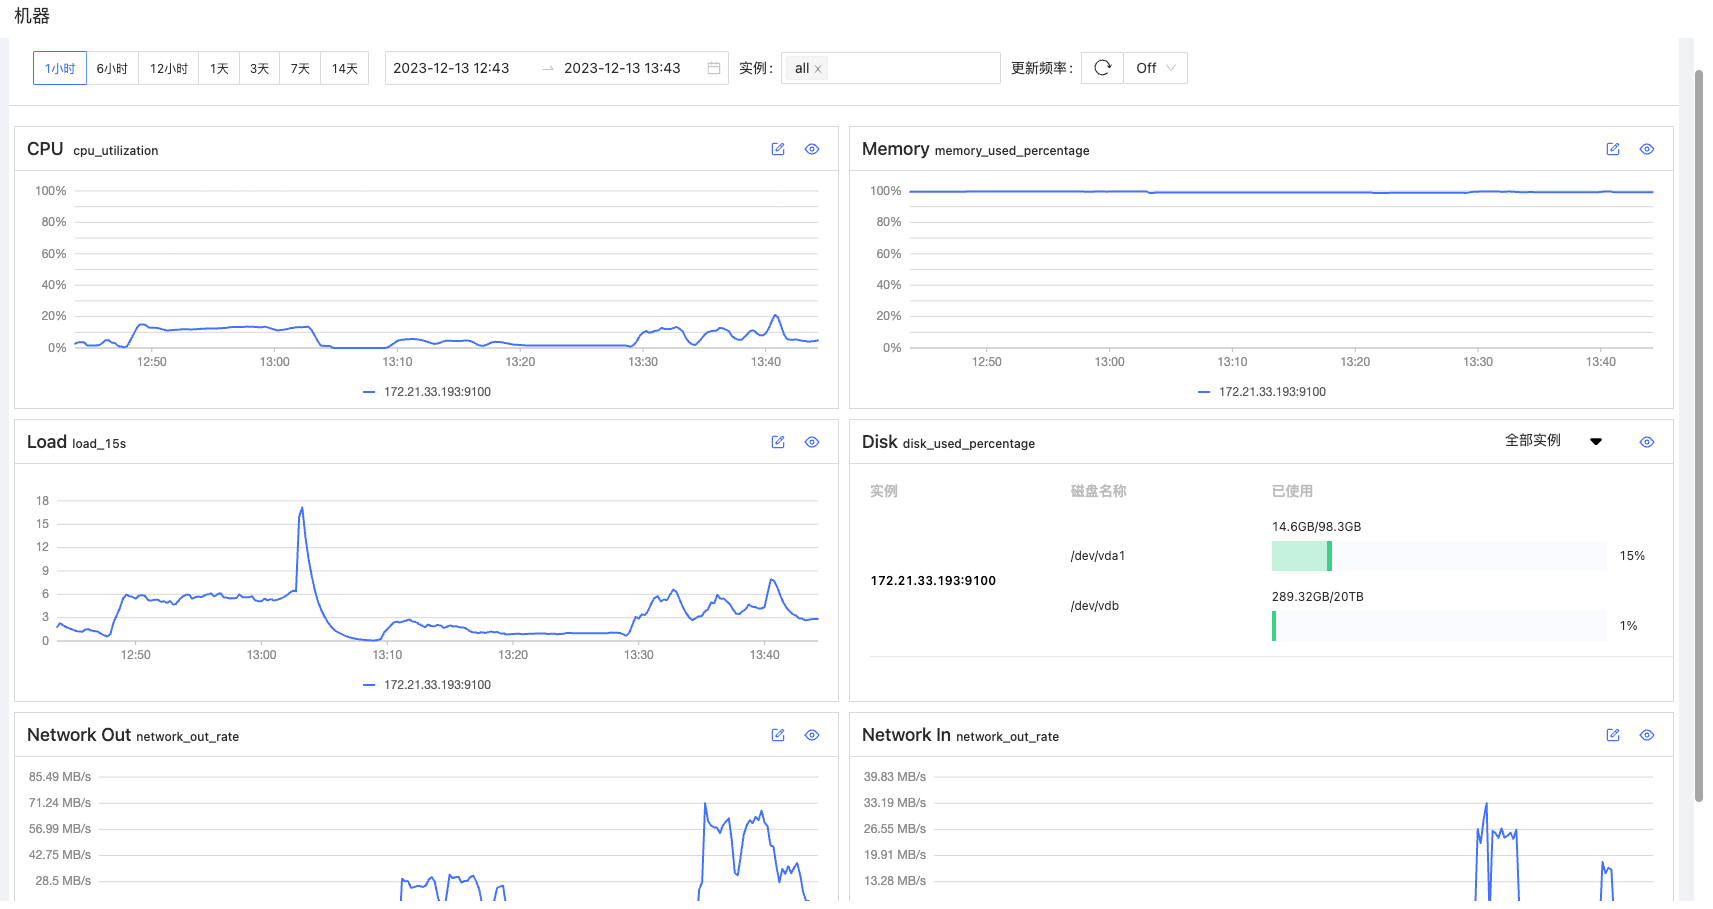
dashboard显示,实际内存100%
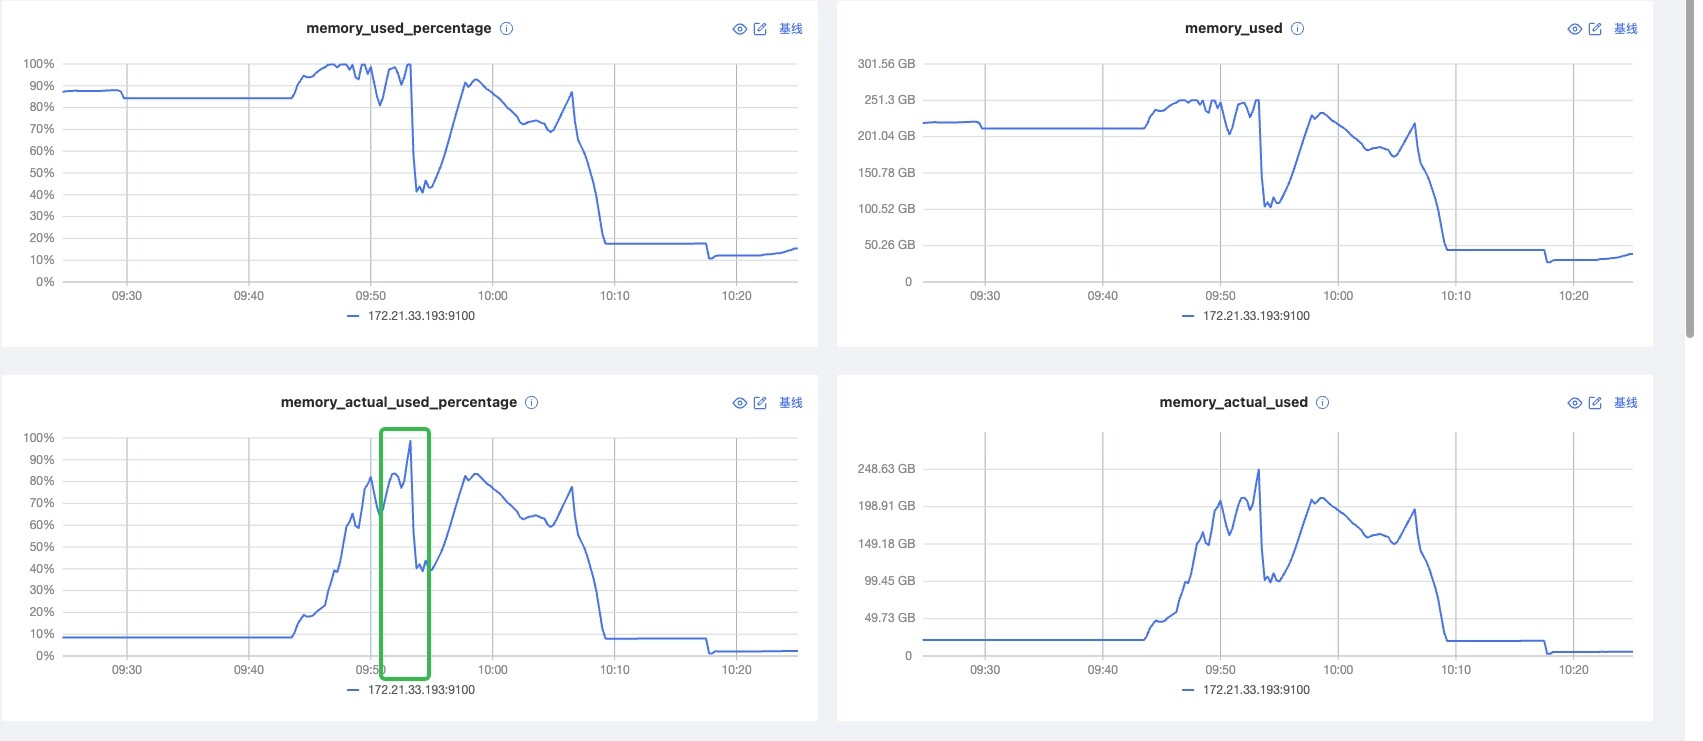
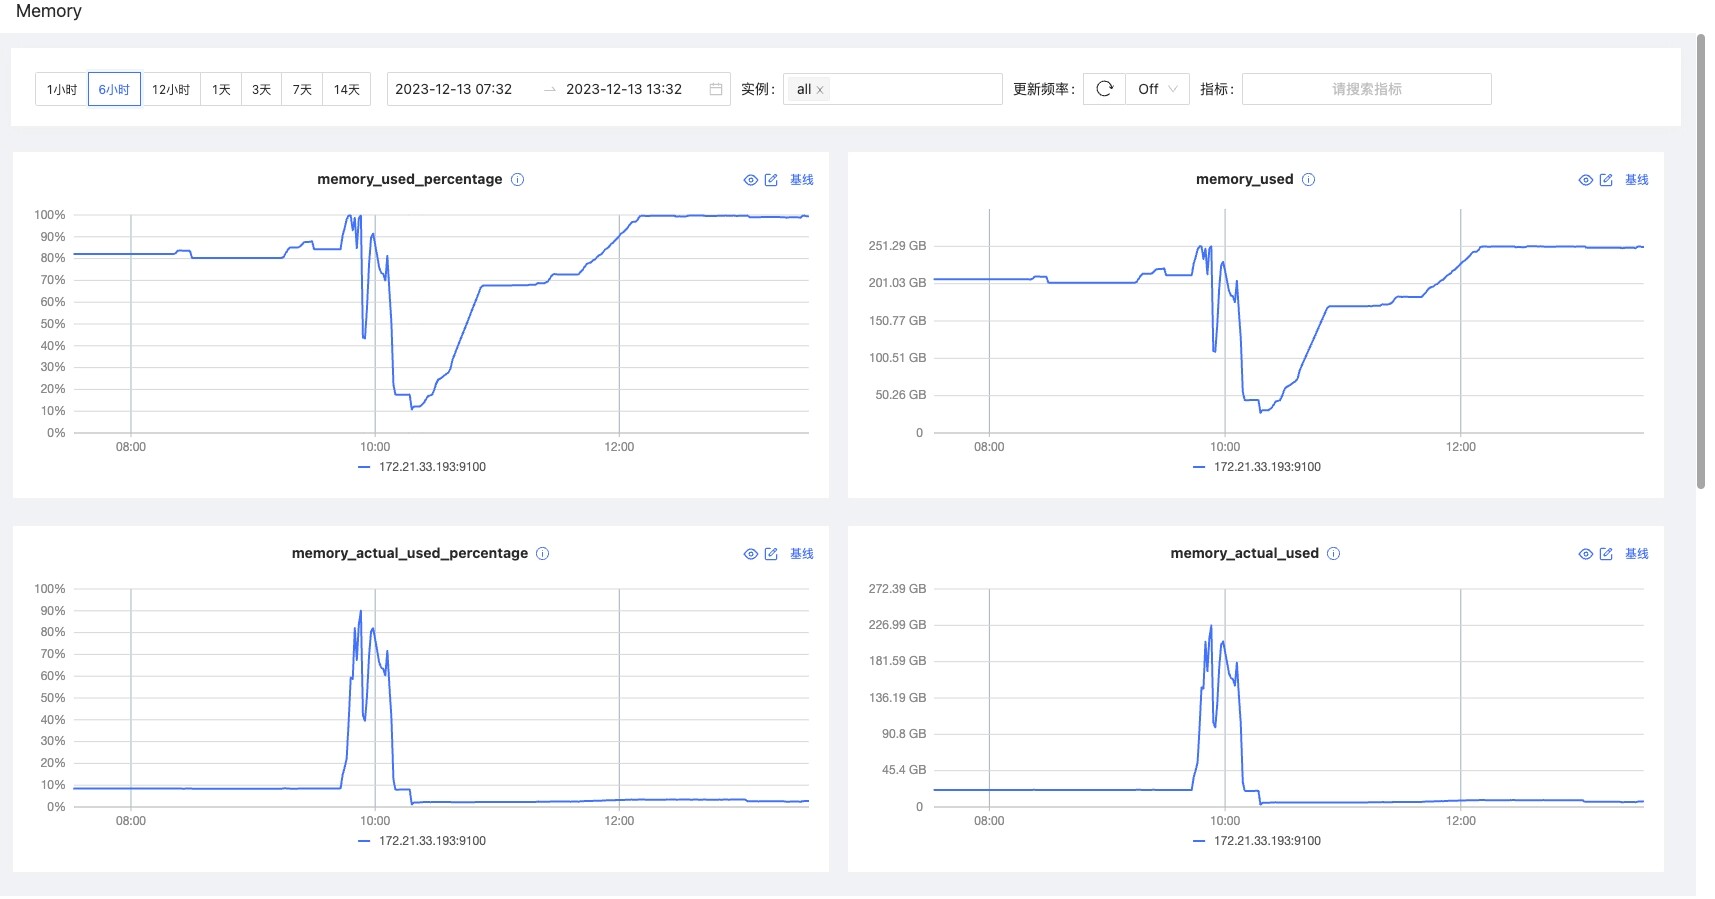
后续排查,在使用过程中,内存使用(包括cache)一直在80%以上,实际占用很小,如图所示
故在论坛查找解决方案
https://discuss.nebula-graph.com.cn/t/topic/7975/4
查找解决方案后,修改配置文件
# The default reserved bytes for one batch operation
--rocksdb_batch_size=4096
# The default block cache size used in BlockBasedTable.
# The unit is MB.
--rocksdb_block_cache=4
# The type of storage engine, `rocksdb', `memory', etc.
--engine_type=rocksdb

# Compression algorithm, options: no,snappy,lz4,lz4hc,zlib,bzip2,zstd
# For the sake of binary compatibility, the default value is snappy.
# Recommend to use:
#   * lz4 to gain more CPU performance, with the same compression ratio with snappy
#   * zstd to occupy less disk space
#   * lz4hc for the read-heavy write-light scenario
--rocksdb_compression=lz4

# Set different compressions for different levels
# For example, if --rocksdb_compression is snappy,
# "no:no:lz4:lz4::zstd" is identical to "no:no:lz4:lz4:snappy:zstd:snappy"
# In order to disable compression for level 0/1, set it to "no:no"
--rocksdb_compression_per_level=

# Whether or not to enable rocksdb's statistics, disabled by default
--enable_rocksdb_statistics=false

# Statslevel used by rocksdb to collection statistics, optional values are
#   * kExceptHistogramOrTimers, disable timer stats, and skip histogram stats
#   * kExceptTimers, Skip timer stats
#   * kExceptDetailedTimers, Collect all stats except time inside mutex lock AND time spent on compression.
#   * kExceptTimeForMutex, Collect all stats except the counters requiring to get time inside the mutex lock.
#   * kAll, Collect all stats
--rocksdb_stats_level=kExceptHistogramOrTimers

# Whether or not to enable rocksdb's prefix bloom filter, enabled by default.
--enable_rocksdb_prefix_filtering=true
# Whether or not to enable rocksdb's whole key bloom filter, disabled by default.
--enable_rocksdb_whole_key_filtering=false
--enable_partitioned_index_filter=true
############## rocksdb Options ##############
# rocksdb DBOptions in json, each name and value of option is a string, given as "option_name":"option_value" separated by comma
--rocksdb_db_options={"max_subcompactions":"4","max_background_jobs":"4","max_open_files":"50000"}
# rocksdb ColumnFamilyOptions in json, each name and value of option is string, given as "option_name":"option_value" separated by comma
--rocksdb_column_family_options={"write_buffer_size":"67108864","max_write_buffer_number":"4","max_bytes_for_level_base":"268435456"}
# rocksdb BlockBasedTableOptions in json, each name and value of option is string, given as "option_name":"option_value" separated by comma
--rocksdb_block_based_table_options={"block_size":"32768","cache_index_and_filter_blocks":"true"}
重启后,内存还是下不来,请问是什么原因