- nebula 版本:3.6.0
- 部署方式:分布式
- 安装方式:deb
- 是否上生产环境:N
- 问题的具体描述
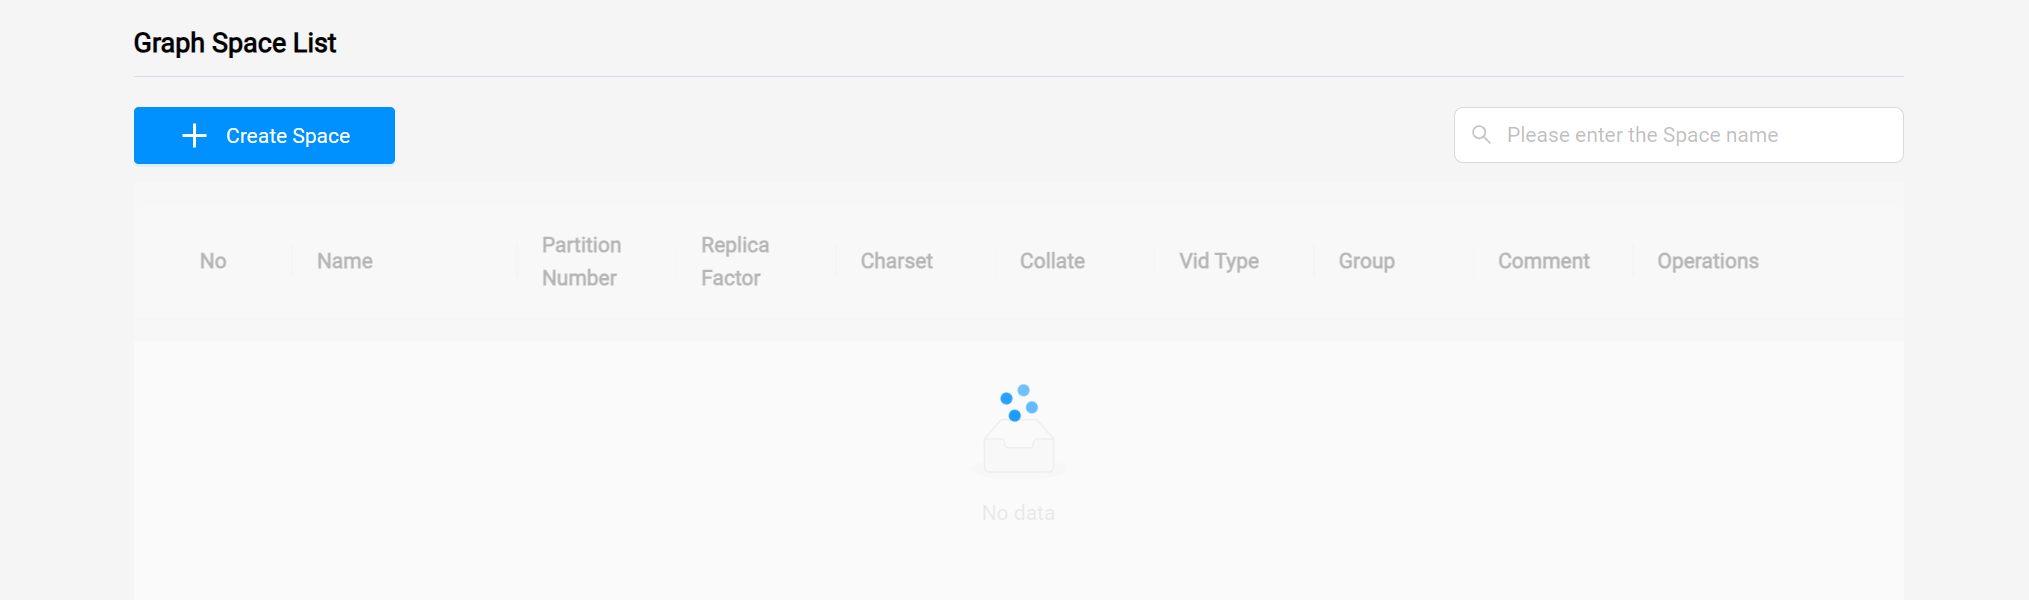
NebulaGraph Studio在加载Schema还有执行语句的时候,一会可以,一会就转圈没反应
日志:
nebula-storaged.BC-GRAGH-1.user.log.INFO.20240129-144750.276880 (8.9 KB)
storaged配置
########## basics ##########
# Whether to run as a daemon process
--daemonize=true
# The file to host the process id
--pid_file=pids/nebula-storaged.pid
# Whether to use the configuration obtained from the configuration file
--local_config=true

########## logging ##########
# The directory to host logging files
--log_dir=logs
# Log level, 0, 1, 2, 3 for INFO, WARNING, ERROR, FATAL respectively
--minloglevel=0
# Verbose log level, 1, 2, 3, 4, the higher of the level, the more verbose of the logging
--v=0
# Maximum seconds to buffer the log messages
--logbufsecs=0
# Whether to redirect stdout and stderr to separate output files
--redirect_stdout=true
# Destination filename of stdout and stderr, which will also reside in log_dir.
--stdout_log_file=storaged-stdout.log
--stderr_log_file=storaged-stderr.log
# Copy log messages at or above this level to stderr in addition to logfiles. The numbers of severity levels INFO, WARNING, ERROR, and FATAL are 0, 1, 2, and 3, respectively.
--stderrthreshold=3
# Wether logging files' name contain time stamp.
--timestamp_in_logfile_name=true

########## networking ##########
# Comma separated Meta server addresses
--meta_server_addrs=192.168.56.75:9559,192.168.56.77:9559,192.168.56.79:9559
# Local IP used to identify the nebula-storaged process.
# Change it to an address other than loopback if the service is distributed or
# will be accessed remotely.
--local_ip=192.168.56.75
# Storage daemon listening port
--port=9779
# HTTP service ip
--ws_ip=0.0.0.0
# HTTP service port
--ws_http_port=19779
# heartbeat with meta service
--heartbeat_interval_secs=10

######### Raft #########
# Raft election timeout
--raft_heartbeat_interval_secs=30
# RPC timeout for raft client (ms)
--raft_rpc_timeout_ms=500
## recycle Raft WAL
--wal_ttl=14400

########## Disk ##########
# Root data path. Split by comma. e.g. --data_path=/disk1/path1/,/disk2/path2/
# One path per Rocksdb instance.
--data_path=/gragh/1/data/gragh/data/storage

# Minimum reserved bytes of each data path
--minimum_reserved_bytes=268435456

# The default reserved bytes for one batch operation
--rocksdb_batch_size=4096
# The default block cache size used in BlockBasedTable.
# The unit is MB.
--rocksdb_block_cache=4
# The type of storage engine, `rocksdb', `memory', etc.
--engine_type=rocksdb

# Compression algorithm, options: no,snappy,lz4,lz4hc,zlib,bzip2,zstd
# For the sake of binary compatibility, the default value is snappy.
# Recommend to use:
#   * lz4 to gain more CPU performance, with the same compression ratio with snappy
#   * zstd to occupy less disk space
#   * lz4hc for the read-heavy write-light scenario
--rocksdb_compression=lz4

# Set different compressions for different levels
# For example, if --rocksdb_compression is snappy,
# "no:no:lz4:lz4::zstd" is identical to "no:no:lz4:lz4:snappy:zstd:snappy"
# In order to disable compression for level 0/1, set it to "no:no"
--rocksdb_compression_per_level=

# Whether or not to enable rocksdb's statistics, disabled by default
--enable_rocksdb_statistics=false

# Statslevel used by rocksdb to collection statistics, optional values are
#   * kExceptHistogramOrTimers, disable timer stats, and skip histogram stats
#   * kExceptTimers, Skip timer stats
#   * kExceptDetailedTimers, Collect all stats except time inside mutex lock AND time spent on compression.
#   * kExceptTimeForMutex, Collect all stats except the counters requiring to get time inside the mutex lock.
#   * kAll, Collect all stats
--rocksdb_stats_level=kExceptHistogramOrTimers

# Whether or not to enable rocksdb's prefix bloom filter, enabled by default.
--enable_rocksdb_prefix_filtering=true
# Whether or not to enable rocksdb's whole key bloom filter, disabled by default.
--enable_rocksdb_whole_key_filtering=false

############## rocksdb Options ##############
# rocksdb DBOptions in json, each name and value of option is a string, given as "option_name":"option_value" separated by comma
--rocksdb_db_options={}
# rocksdb ColumnFamilyOptions in json, each name and value of option is string, given as "option_name":"option_value" separated by comma
--rocksdb_column_family_options={"write_buffer_size":"67108864","max_write_buffer_number":"4","max_bytes_for_level_base":"268435456"}
# rocksdb BlockBasedTableOptions in json, each name and value of option is string, given as "option_name":"option_value" separated by comma
--rocksdb_block_based_table_options={"block_size":"8192"}

############### misc ####################
# Whether turn on query in multiple thread
--query_concurrently=true
# Whether remove outdated space data
--auto_remove_invalid_space=true
# Network IO threads number
--num_io_threads=16
# Max active connections for all networking threads. 0 means no limit.
# Max connections for each networking thread = num_max_connections / num_netio_threads
--num_max_connections=0
# Worker threads number to handle request
--num_worker_threads=32
# Maximum subtasks to run admin jobs concurrently
--max_concurrent_subtasks=10
# The rate limit in bytes when leader synchronizes snapshot data
--snapshot_part_rate_limit=10485760
# The amount of data sent in each batch when leader synchronizes snapshot data
--snapshot_batch_size=1048576
# The rate limit in bytes when leader synchronizes rebuilding index
--rebuild_index_part_rate_limit=4194304
# The amount of data sent in each batch when leader synchronizes rebuilding index
--rebuild_index_batch_size=1048576

########## memory tracker ##########
# trackable memory ratio (trackable_memory / (total_memory - untracked_reserved_memory) )
--memory_tracker_limit_ratio=0.8
# untracked reserved memory in Mib
--memory_tracker_untracked_reserved_memory_mb=50

# enable log memory tracker stats periodically
--memory_tracker_detail_log=false
# log memory tacker stats interval in milliseconds
--memory_tracker_detail_log_interval_ms=60000

# enable memory background purge (if jemalloc is used)
--memory_purge_enabled=true
# memory background purge interval in seconds
--memory_purge_interval_seconds=10
metad配置
########## basics ##########
# Whether to run as a daemon process
--daemonize=true
# The file to host the process id
--pid_file=pids/nebula-metad.pid

########## logging ##########
# The directory to host logging files
--log_dir=logs
# Log level, 0, 1, 2, 3 for INFO, WARNING, ERROR, FATAL respectively
--minloglevel=0
# Verbose log level, 1, 2, 3, 4, the higher of the level, the more verbose of the logging
--v=0
# Maximum seconds to buffer the log messages
--logbufsecs=0
# Whether to redirect stdout and stderr to separate output files
--redirect_stdout=true
# Destination filename of stdout and stderr, which will also reside in log_dir.
--stdout_log_file=metad-stdout.log
--stderr_log_file=metad-stderr.log
# Copy log messages at or above this level to stderr in addition to logfiles. The numbers of severity levels INFO, WARNING, ERROR, and FATAL are 0, 1, 2, and 3, respectively.
--stderrthreshold=3
# wether logging files' name contain time stamp, If Using logrotate to rotate logging files, than should set it to true.
--timestamp_in_logfile_name=true

########## networking ##########
# Comma separated Meta Server addresses
--meta_server_addrs=192.168.56.75:9559,192.168.56.77:9559,192.168.56.79:9559
# Local IP used to identify the nebula-metad process.
# Change it to an address other than loopback if the service is distributed or
# will be accessed remotely.
--local_ip=192.168.56.75
# Meta daemon listening port
--port=9559
# HTTP service ip
--ws_ip=0.0.0.0
# HTTP service port
--ws_http_port=19559
# Port to listen on Storage with HTTP protocol, it corresponds to ws_http_port in storage's configuration file
--ws_storage_http_port=19779

########## storage ##########
# Root data path, here should be only single path for metad
--data_path=/gragh/1/data/gragh/data/meta

########## Misc #########
# The default number of parts when a space is created
--default_parts_num=100
# The default replica factor when a space is created
--default_replica_factor=1

--heartbeat_interval_secs=10
--agent_heartbeat_interval_secs=60
