- nebula 版本:1.2
- 部署方式(分布式 / 单机 / Docker / DBaaS):docker swarm

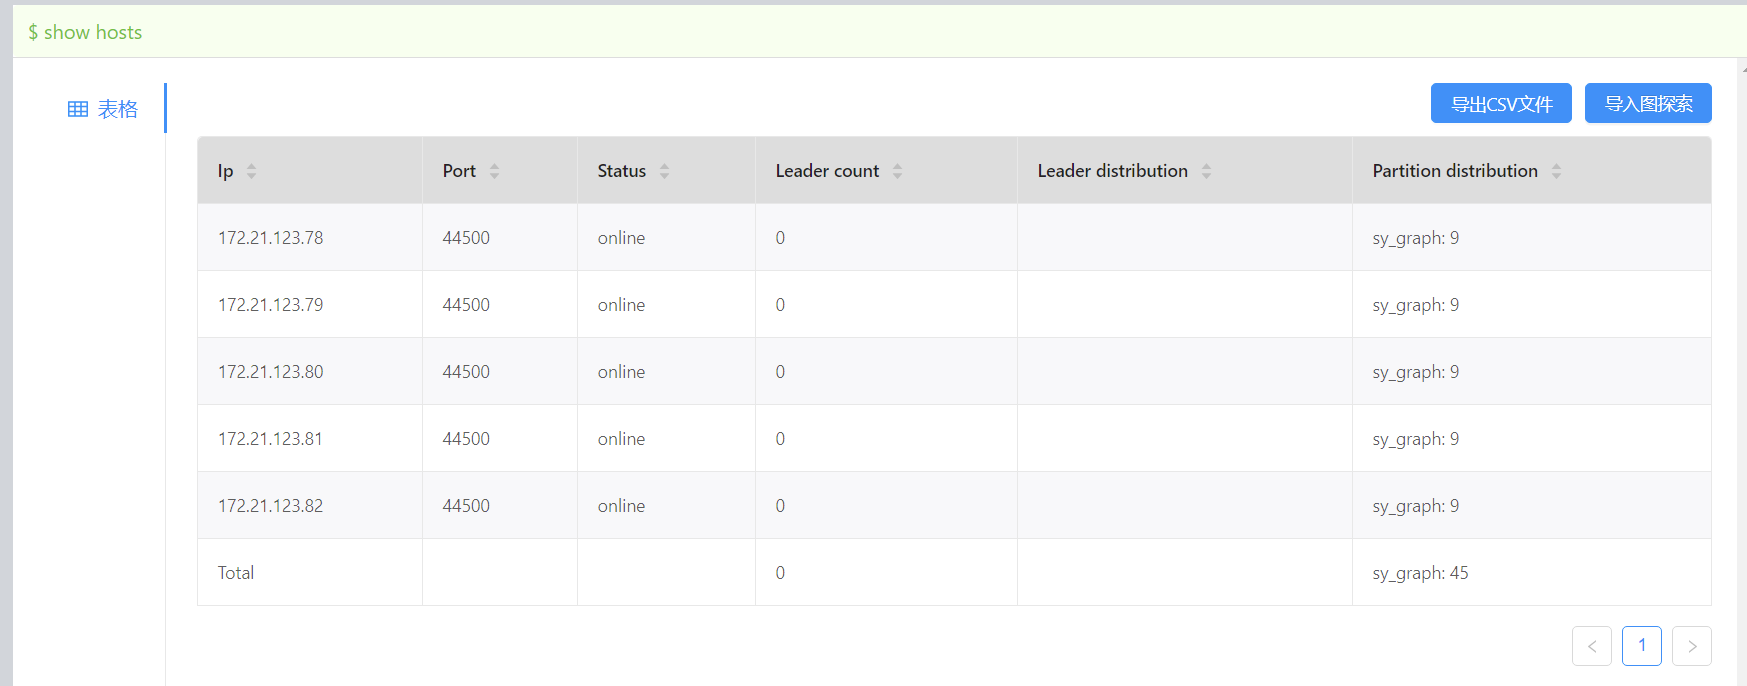
一直显示为0
已提交balance data
人工置顶
你从 console 里面查询呢?排除一下 web 平台的问题
 稍等,我这边访问有点麻烦,得爬楼梯
console还得搞个镜像传到生产环境上去,f12看nebula响应的数据应该一样效果
@darionyaphet 来了大佬
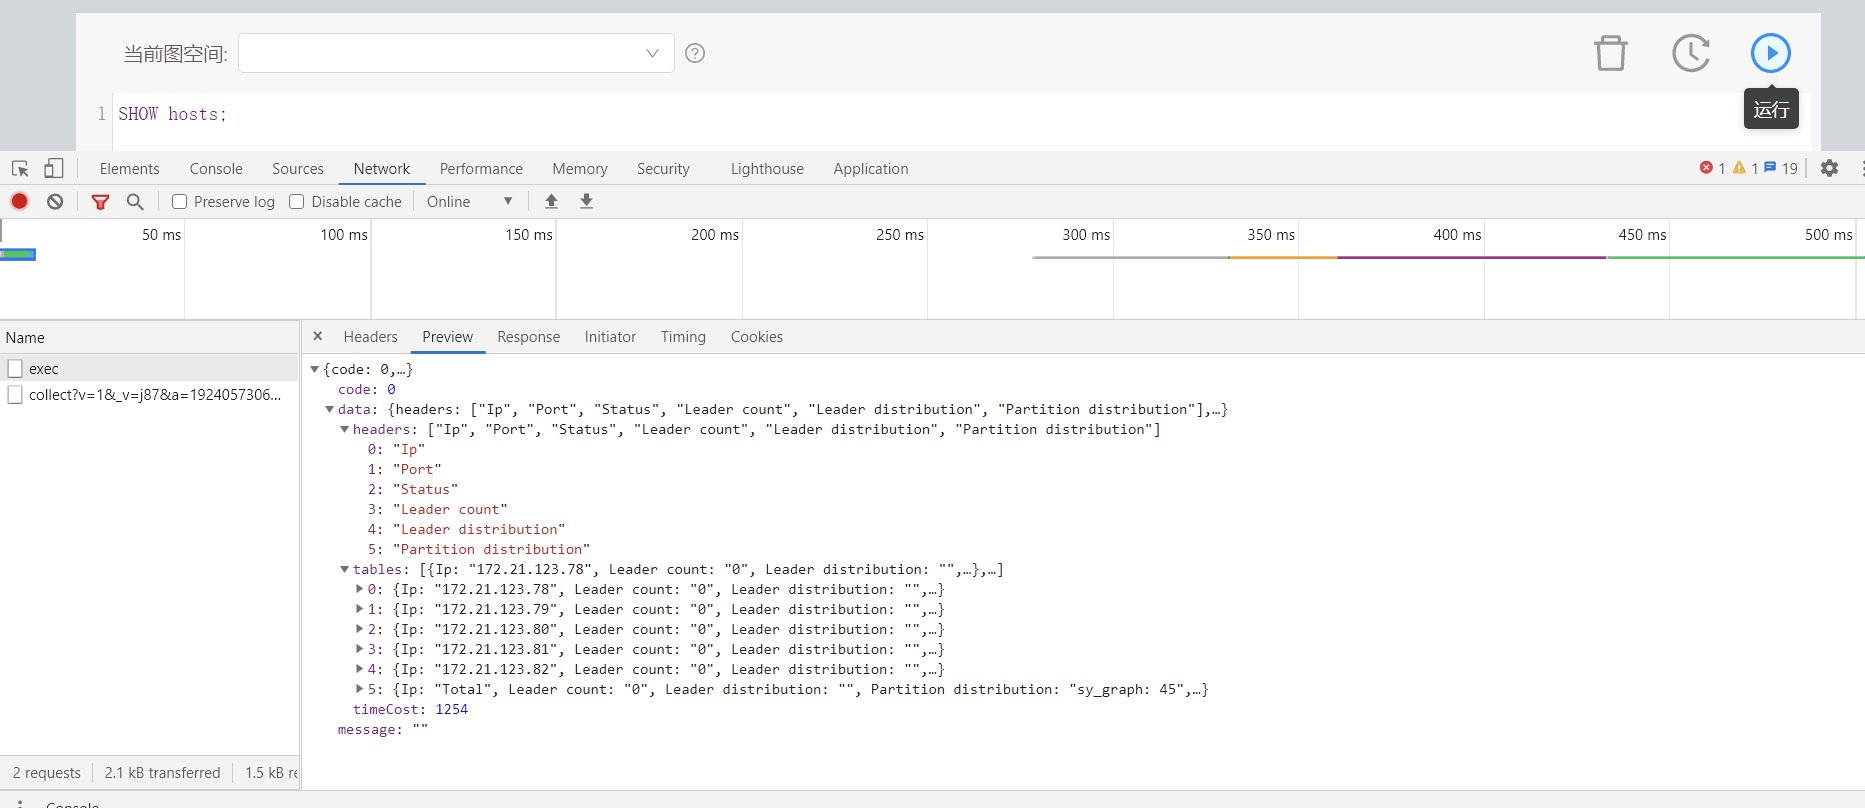
{
  "code": 0,
  "data": {
    "headers": [
      "Ip",
      "Port",
      "Status",
      "Leader count",
      "Leader distribution",
      "Partition distribution"
    ],
    "tables": [
      {
        "Ip": "172.21.123.78",
        "Leader count": "0",
        "Leader distribution": "",
        "Partition distribution": "sy_graph: 9",
        "Port": "44500",
        "Status": "online"
      },
      {
        "Ip": "172.21.123.79",
        "Leader count": "0",
        "Leader distribution": "",
        "Partition distribution": "sy_graph: 9",
        "Port": "44500",
        "Status": "online"
      },
      {
        "Ip": "172.21.123.80",
        "Leader count": "0",
        "Leader distribution": "",
        "Partition distribution": "sy_graph: 9",
        "Port": "44500",
        "Status": "online"
      },
      {
        "Ip": "172.21.123.81",
        "Leader count": "0",
        "Leader distribution": "",
        "Partition distribution": "sy_graph: 9",
        "Port": "44500",
        "Status": "online"
      },
      {
        "Ip": "172.21.123.82",
        "Leader count": "0",
        "Leader distribution": "",
        "Partition distribution": "sy_graph: 9",
        "Port": "44500",
        "Status": "online"
      },
      {
        "Ip": "Total",
        "Leader count": "0",
        "Leader distribution": "",
        "Partition distribution": "sy_graph: 45",
        "Port": "",
        "Status": ""
      }
    ],
    "timeCost": 1254
  },
  "message": ""
}
大佬 我的意思是 找个 nebula console 连一下看看 ~
不应该是一样的效果么,我这传一个文件到服务器上贼麻烦
人工顶下
要不要看看 storage 的日志,是否没能选出 leader ?
现在执行查询还能返回结果?
可以返回结果,表面看起来正常
那需要看看 metad 和 storaged 的日志了,如果请求都能正常返回,应该是有 leader 选出,但是为什么没有在 meta 中查出来对应的 leader 信息就个问题了?追下日志,或者你回忆一下最近有什么操作,看看能否复现这个问题?
那你有没有尝试重新启动所有的 storage 和 meta 的服务?因为 drop space 后数据不一定真的删除(需要 compact)
本机用1.2 版本验证了一下,space 删除重建 show parts显示的 leader是正常的,
用户那边检查一下服务状态 show hosts ,./scripts/nebula.service status all
没有重启storage和meta服务,有做compact