Nebula Graph 2.0 rpm 安装后报‘Meta Data Path should not empty’

  • nebula 版本:nebula-graph-2.0.0-rc1.el7.x86_64
  • 部署方式(rpm 分布式):
  • 硬件信息
    • 磁盘 SSD
    • CPU:Intel® Xeon® CPU E5-2680 v3 @ 2.50GHz, 8核
    • 内存:32G
  • 问题的具体描述
    Nebula Graph 2.0 rpm 安装后报‘Meta Data Path should not empty’
  • 相关的 meta / storage / graph info 日志信息
    meta 日志:E0309 17:54:51.507277 116482 MetaDaemon.cpp:187] Meta Data Path should not empty
    Storage日:E0309 17:54:51.559170 116498 StorageDaemon.cpp:75] Storage Data Path should not empty

nebular-metad.conf 配置

########## basics ##########
# Whether to run as a daemon process
--daemonize=true
# The file to host the process id
--pid_file=pids/nebula-metad.pid

########## logging ##########
# The directory to host logging files, which must already exists
--log_dir=logs
# Log level, 0, 1, 2, 3 for INFO, WARNING, ERROR, FATAL respectively
--minloglevel=0
# Verbose log level, 1, 2, 3, 4, the higher of the level, the more verbose of the logging
--v=0
# Maximum seconds to buffer the log messages
--logbufsecs=0

erver_addrs=100.100.23.87:45500,100.100.22.169:45500,100.100.22.118:4550
0
######### networking ##########
# Comma separated Meta Server addresses
--meta_server_addrs=100.100.23.87:45500,100.100.22.169:45500,100.100.22.118:45500
# Local IP used to identify the nebula-metad process.
# Change it to an address other than loopback if the service is distributed or
# will be accessed remotely.
--local_ip=100.100.23.87
# Meta daemon listening port
--port=45500
# HTTP service ip
--ws_ip=0.0.0.0
# HTTP service port
--ws_http_port=19559
# HTTP2 service port
--ws_h2_port=19560

########## storage ##########
# Root data path, here should be only single path for metad
--data_path=data/meta

########## Misc #########
# The default number of parts when a space is created
--default_parts_num=100
# The default replica factor when a space is created
--default_replica_factor=1

--heartbeat_interval_secs=10

你的nebular-metad.conf 里面有–data_path=data/meta 这个配置啊
你ps 一下,看看metad启动的时候,meta的conf是这个文件吗?

ps 命令具体怎么用?

这个是linux基本命令。可以百度下

感觉 meta 都没有起来

ps -ef|grep nebula
root 91084 1 0 Mar09 ? 00:00:29 /usr/local/nebula/bin/nebula-graphd --flagfile /usr/local/nebula/etc/nebula-graphd.conf

[root@szxphispre00219 etc]# ls
nebula-graphd.conf nebula-metad.conf nebula-storaged.conf
nebula-graphd.conf_bk nebula-metad.conf.default nebula-storaged.conf_bk
nebula-graphd.conf.default nebula-metad.conf.default_bk nebula-storaged.conf.default
nebula-graphd.conf.production nebula-metad.conf.production nebula-storaged.conf.production

  1. 看看这个目录下的metad.conf是你启动的时候那个吗?里面的data_path是啥?
  2. 看看这meta对应的log目录stderr.log 和nebula-metad.ERROR

1.我怎样确定这个目录下的metad.conf 就是我启动的时候那个呢?里面的data_path 就是
–data_path=data/meta
2. a. 没有找到stderr.log
b.nebula.metad.ERROR

Log file created at: 2021/03/09 17:54:51
Running on machine: szxphispre00219
Log line format: [IWEF]mmdd hh:mm:ss.uuuuuu threadid file:line] msg
E0309 17:54:51.507277 116482 MetaDaemon.cpp:187] Meta Data Path should not empty

/usr/local/nebula/scripts/nebula.service -c /usr/local/nebula/etc/nebula-metad.conf start metad > 1.log 2>&1 &

看看这样启动后报啥错

[root@szxphispre00219 etc]# /usr/local/nebula/scripts/nebula.service -c /usr/local/nebula/etc/nebula-metad.conf start metad > 1.log 2>&1 &
[3] 66731
[2] Done /usr/local/nebula/scripts/nebula.service -c /usr/local/nebula/etc/nebula-metad.conf start metad > 1.log 2>&1

nebula.metad.ERROR
Log file created at: 2021/03/10 10:05:20
Running on machine: szxphispre00219
Log line format: [IWEF]mmdd hh:mm:ss.uuuuuu threadid file:line] msg
E0310 10:05:20.129217 65483 MetaDaemon.cpp:187] Meta Data Path should not empty

metad的配置文件,你改过吧?感觉后面的不认了啊?
下面的图中,你改的配置文件,改丢了东西了吧?:joy:

1 个赞

已经起来了,用什么命令可以查看集群的所有节点?

show hosts;
show hosts storage;
show hosts graph;
show hosts meta;

2.0 的版本没有带console,可以提供一个centOS 版本的console吗?

有个console repo,自己去下个就行了

有一个节点的storage 的状态是 OFFLINE

(root@nebula) [(none)]> show hosts storage
+------------------+------+-----------+-----------+--------------+
| Host             | Port | Status    | Role      | Git Info Sha |
+------------------+------+-----------+-----------+--------------+
| "127.0.0.1"      | 9779 | "OFFLINE" | "STORAGE" | "09270f5"    |
+------------------+------+-----------+-----------+--------------+
| "100.100.22.118" | 9779 | "ONLINE"  | "STORAGE" | "09270f5"    |
+------------------+------+-----------+-----------+--------------+
| "100.100.22.169" | 9779 | "ONLINE"  | "STORAGE" | "09270f5"    |
+------------------+------+-----------+-----------+--------------+

nebula-storaged.ERROR
Log file created at: 2021/03/10 16:30:48
Running on machine: szxphispre00219
Log line format: [IWEF]mmdd hh:mm:ss.uuuuuu threadid file:line] msg
E0310 16:30:48.885501 41678 MetaClient.cpp:60] Heartbeat failed, status:wrong cluster!
E0310 16:30:50.888677 41678 MetaClient.cpp:60] Heartbeat failed, status:wrong cluster!
E0310 16:30:52.891156 41678 MetaClient.cpp:60] Heartbeat failed, status:wrong cluster!

nebula-storaged.conf

    ########## networking ##########
    # Comma separated Meta server addresses
    --meta_server_addrs=100.100.23.87:9559,100.100.22.169:9559,100.100.22.118:9559
    # Local IP used to identify the nebula-storaged process.
    # Change it to an address other than loopback if the service is distributed or
    # will be accessed remotely.
    --local_ip=100.100.23.87
    # Storage daemon listening port
    --port=9779
    # HTTP service ip
    --ws_ip=0.0.0.0
    # HTTP service port
    --ws_http_port=19779
    # HTTP2 service port
    --ws_h2_port=19780

这不是很明显吗?
你一个host没有改啊

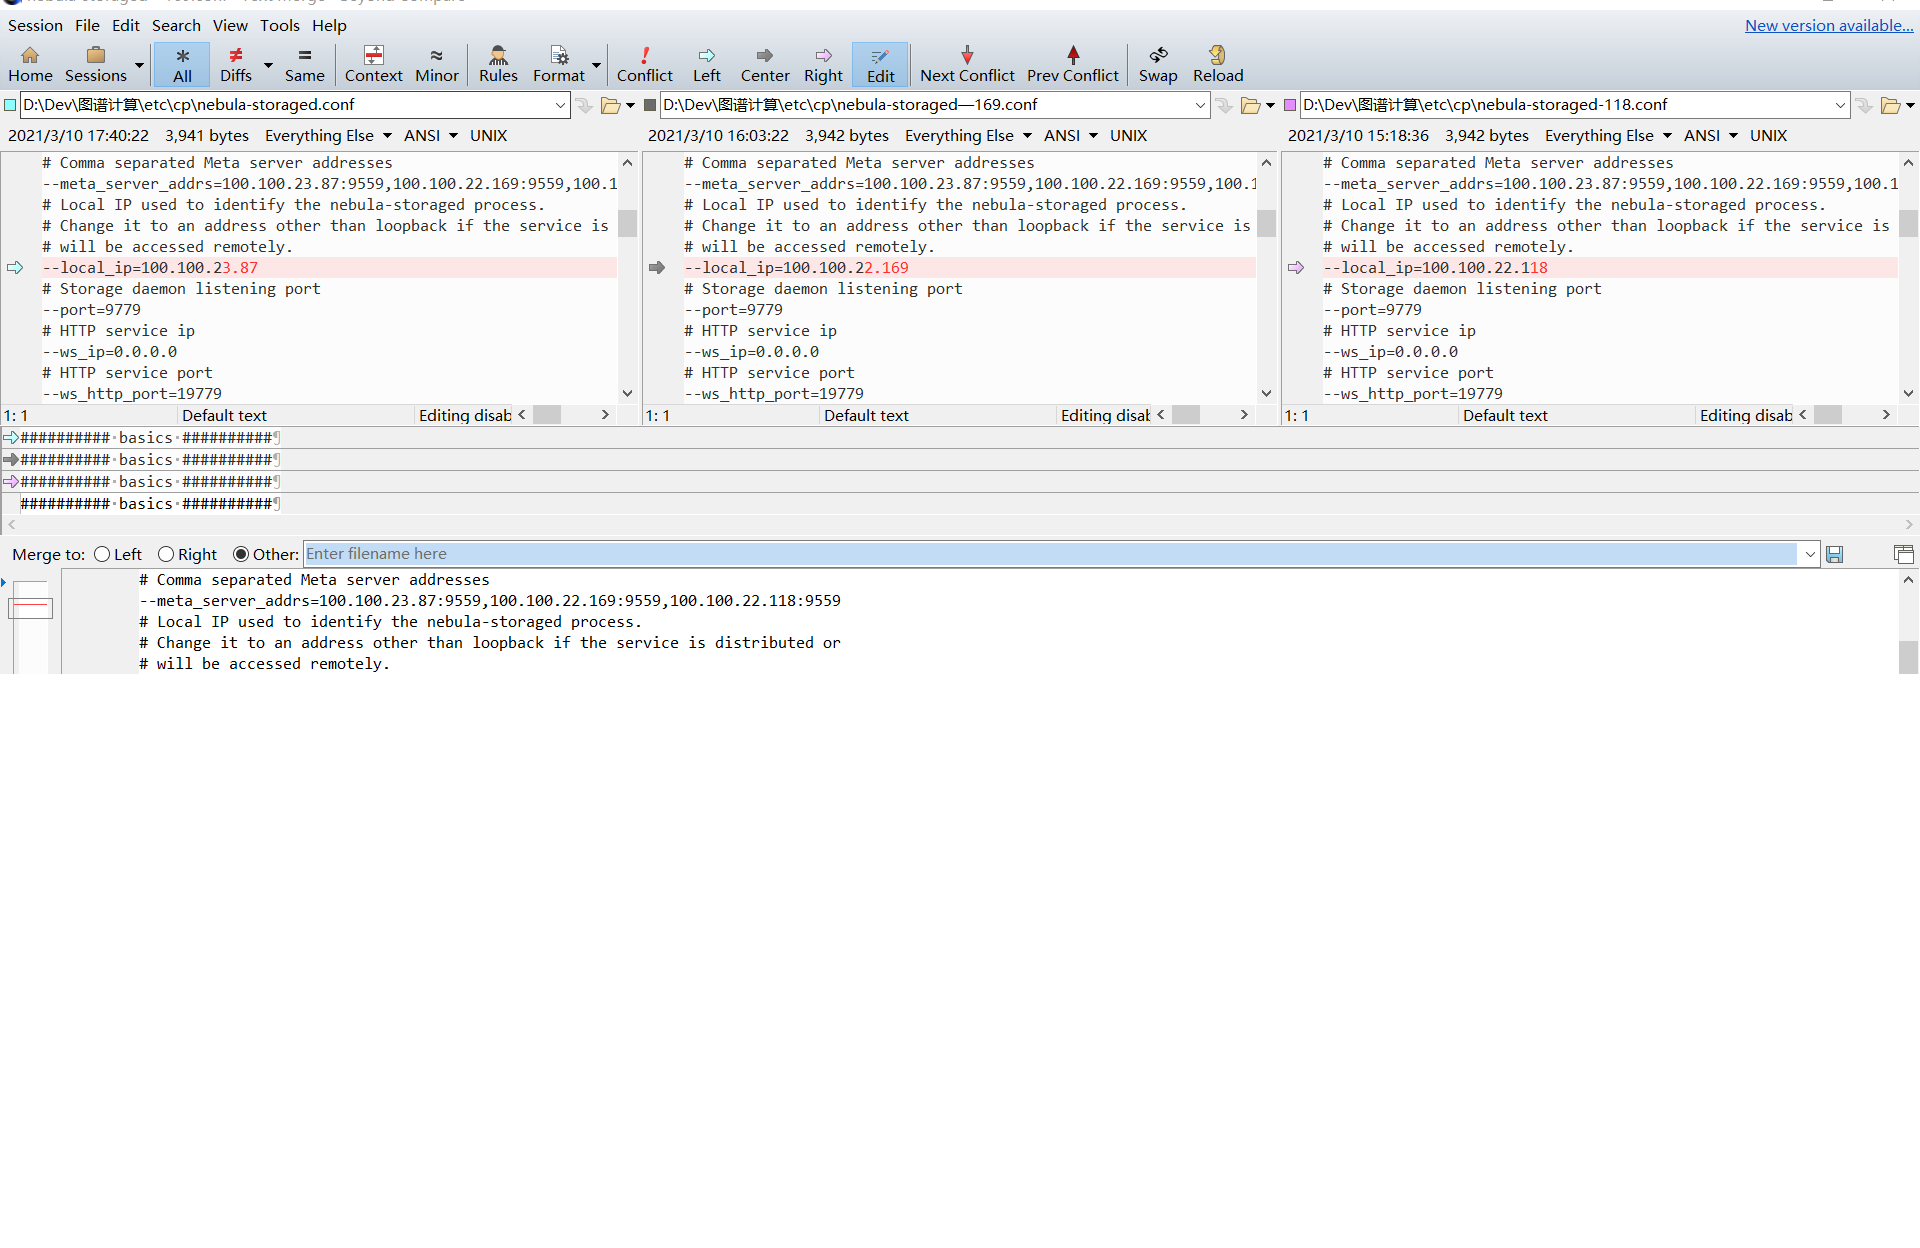
反复对比过了,100.100.23.87 这个host的nebula-storaged.conf已经修改过了

########## basics ##########
# Whether to run as a daemon process
--daemonize=true
# The file to host the process id
--pid_file=pids/nebula-storaged.pid

########## logging ##########
# The directory to host logging files, which must already exists
--log_dir=logs
# Log level, 0, 1, 2, 3 for INFO, WARNING, ERROR, FATAL respectively
--minloglevel=0
# Verbose log level, 1, 2, 3, 4, the higher of the level, the more verbose of the logging
--v=0
# Maximum seconds to buffer the log messages
--logbufsecs=0

########## networking ##########
# Comma separated Meta server addresses
--meta_server_addrs=100.100.23.87:9559,100.100.22.169:9559,100.100.22.118:9559
# Local IP used to identify the nebula-storaged process.
# Change it to an address other than loopback if the service is distributed or
# will be accessed remotely.
--local_ip=100.100.23.87
# Storage daemon listening port
--port=9779
# HTTP service ip
--ws_ip=0.0.0.0
# HTTP service port
--ws_http_port=19779
# HTTP2 service port
--ws_h2_port=19780

######### Raft #########
# Raft election timeout
--raft_heartbeat_interval_secs=30
# RPC timeout for raft client (ms)
--raft_rpc_timeout_ms=500
## recycle Raft WAL
--wal_ttl=14400

########## Disk ##########
# Root data path. Split by comma. e.g. --data_path=/disk1/path1/,/disk2/path2/
# One path per Rocksdb instance.
--data_path=data/storage

# The default reserved bytes for one batch operation
--rocksdb_batch_size=4096
# The default block cache size used in BlockBasedTable.
# The unit is MB.
--rocksdb_block_cache=4
# The type of storage engine, `rocksdb', `memory', etc.
--engine_type=rocksdb

# Compression algorithm, options: no,snappy,lz4,lz4hc,zlib,bzip2,zstd
# For the sake of binary compatibility, the default value is snappy.
# Recommend to use:
#   * lz4 to gain more CPU performance, with the same compression ratio with snappy
#   * zstd to occupy less disk space
#   * lz4hc for the read-heavy write-light scenario
--rocksdb_compression=lz4

# Set different compressions for different levels
# For example, if --rocksdb_compression is snappy,
# "no:no:lz4:lz4::zstd" is identical to "no:no:lz4:lz4:snappy:zstd:snappy"
# In order to disable compression for level 0/1, set it to "no:no"
--rocksdb_compression_per_level=

# Whether or not to enable rocksdb's statistics, disabled by default
--enable_rocksdb_statistics=false

# Statslevel used by rocksdb to collection statistics, optional values are
#   * kExceptHistogramOrTimers, disable timer stats, and skip histogram stats
#   * kExceptTimers, Skip timer stats
#   * kExceptDetailedTimers, Collect all stats except time inside mutex lock AND time spent on compression.
#   * kExceptTimeForMutex, Collect all stats except the counters requiring to get time inside the mutex lock.
#   * kAll, Collect all stats
--rocksdb_stats_level=kExceptHistogramOrTimers

# Whether or not to enable rocksdb's prefix bloom filter, disabled by default.
--enable_rocksdb_prefix_filtering=false
# Whether or not to enable the whole key filtering.
--enable_rocksdb_whole_key_filtering=true
# The prefix length for each key to use as the filter value.
# can be 12 bytes(PartitionId + VertexID), or 16 bytes(PartitionId + VertexID + TagID/EdgeType).
--rocksdb_filtering_prefix_length=12

############## rocksdb Options ##############
--rocksdb_disable_wal=true
# rocksdb DBOptions in json, each name and value of option is a string, given as "option_name":"option_value" separated by comma
--rocksdb_db_options={}
# rocksdb ColumnFamilyOptions in json, each name and value of option is string, given as "option_name":"option_value" separated by comma
--rocksdb_column_family_options={"write_buffer_size":"67108864","max_write_buffer_number":"4","max_bytes_for_level_base":"268435456"}
# rocksdb BlockBasedTableOptions in json, each name and value of option is string, given as "option_name":"option_value" separated by comma
--rocksdb_block_based_table_options={"block_size":"8192"}

三个host的nebula-storaged.conf 的配置是一样的,只是local IP不一样。就仅仅100.100.23.87这个host启动不了,其他两个都启动了。

那你单独起动下这个storaged看看log 吧

单独启动storage,报:E0311 09:21:50.121960 77796 FileUtils.cpp:384] Failed to read the directory "data/storage/nebula" (2): No such file or directory 没有配置过data/storage/nebula这个目录。

########## Disk ##########

Root data path. Split by comma. e.g. --data_path=/disk1/path1/,/disk2/path2/

One path per Rocksdb instance.

–data_path=data/storage