提问参考模版:
- nebula 版本:v2 (用的是v2-nightly的镜像)
- 部署方式(分布式 / 单机 / Docker / DBaaS):docker compose
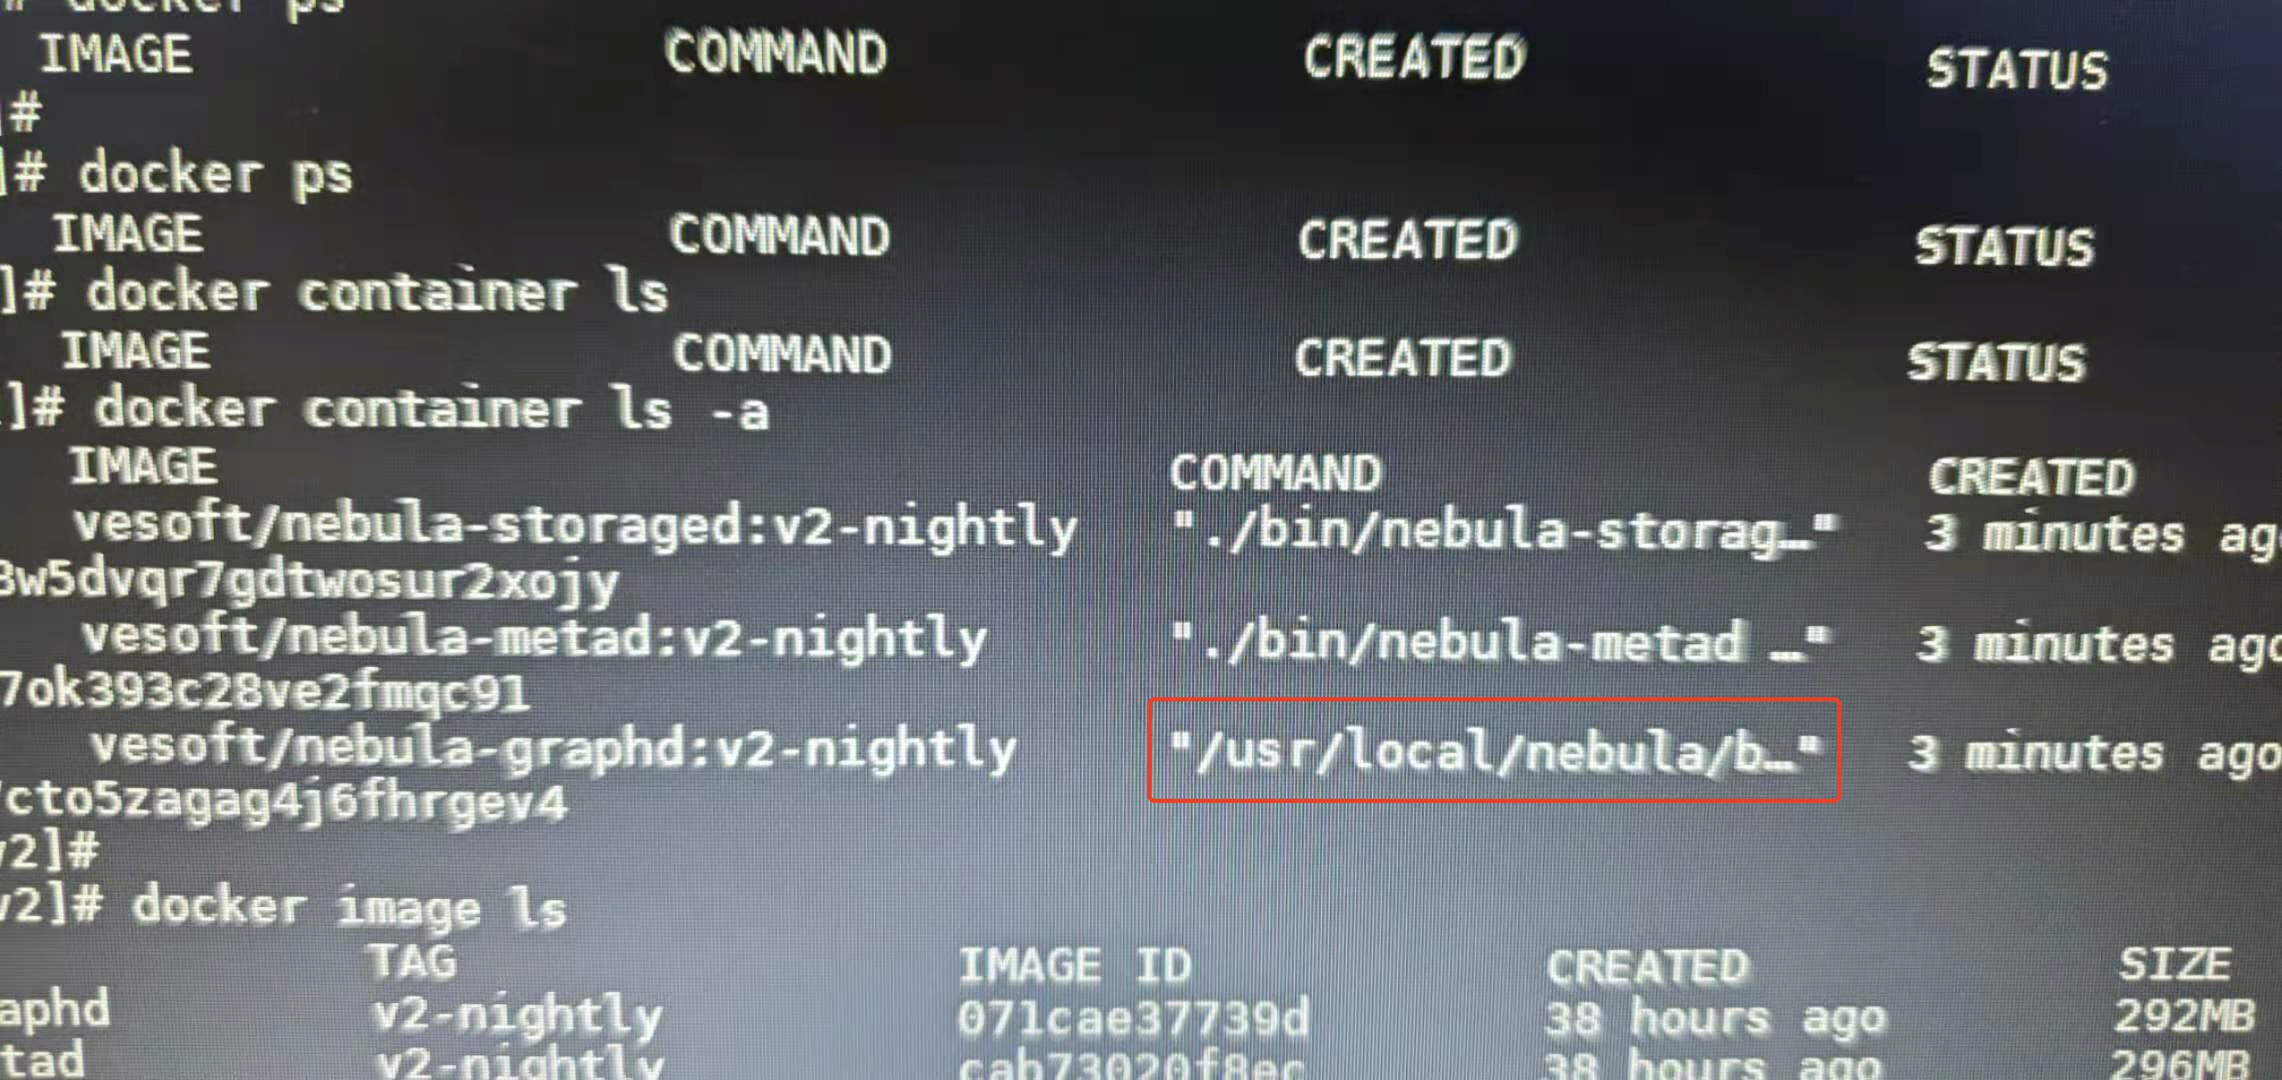
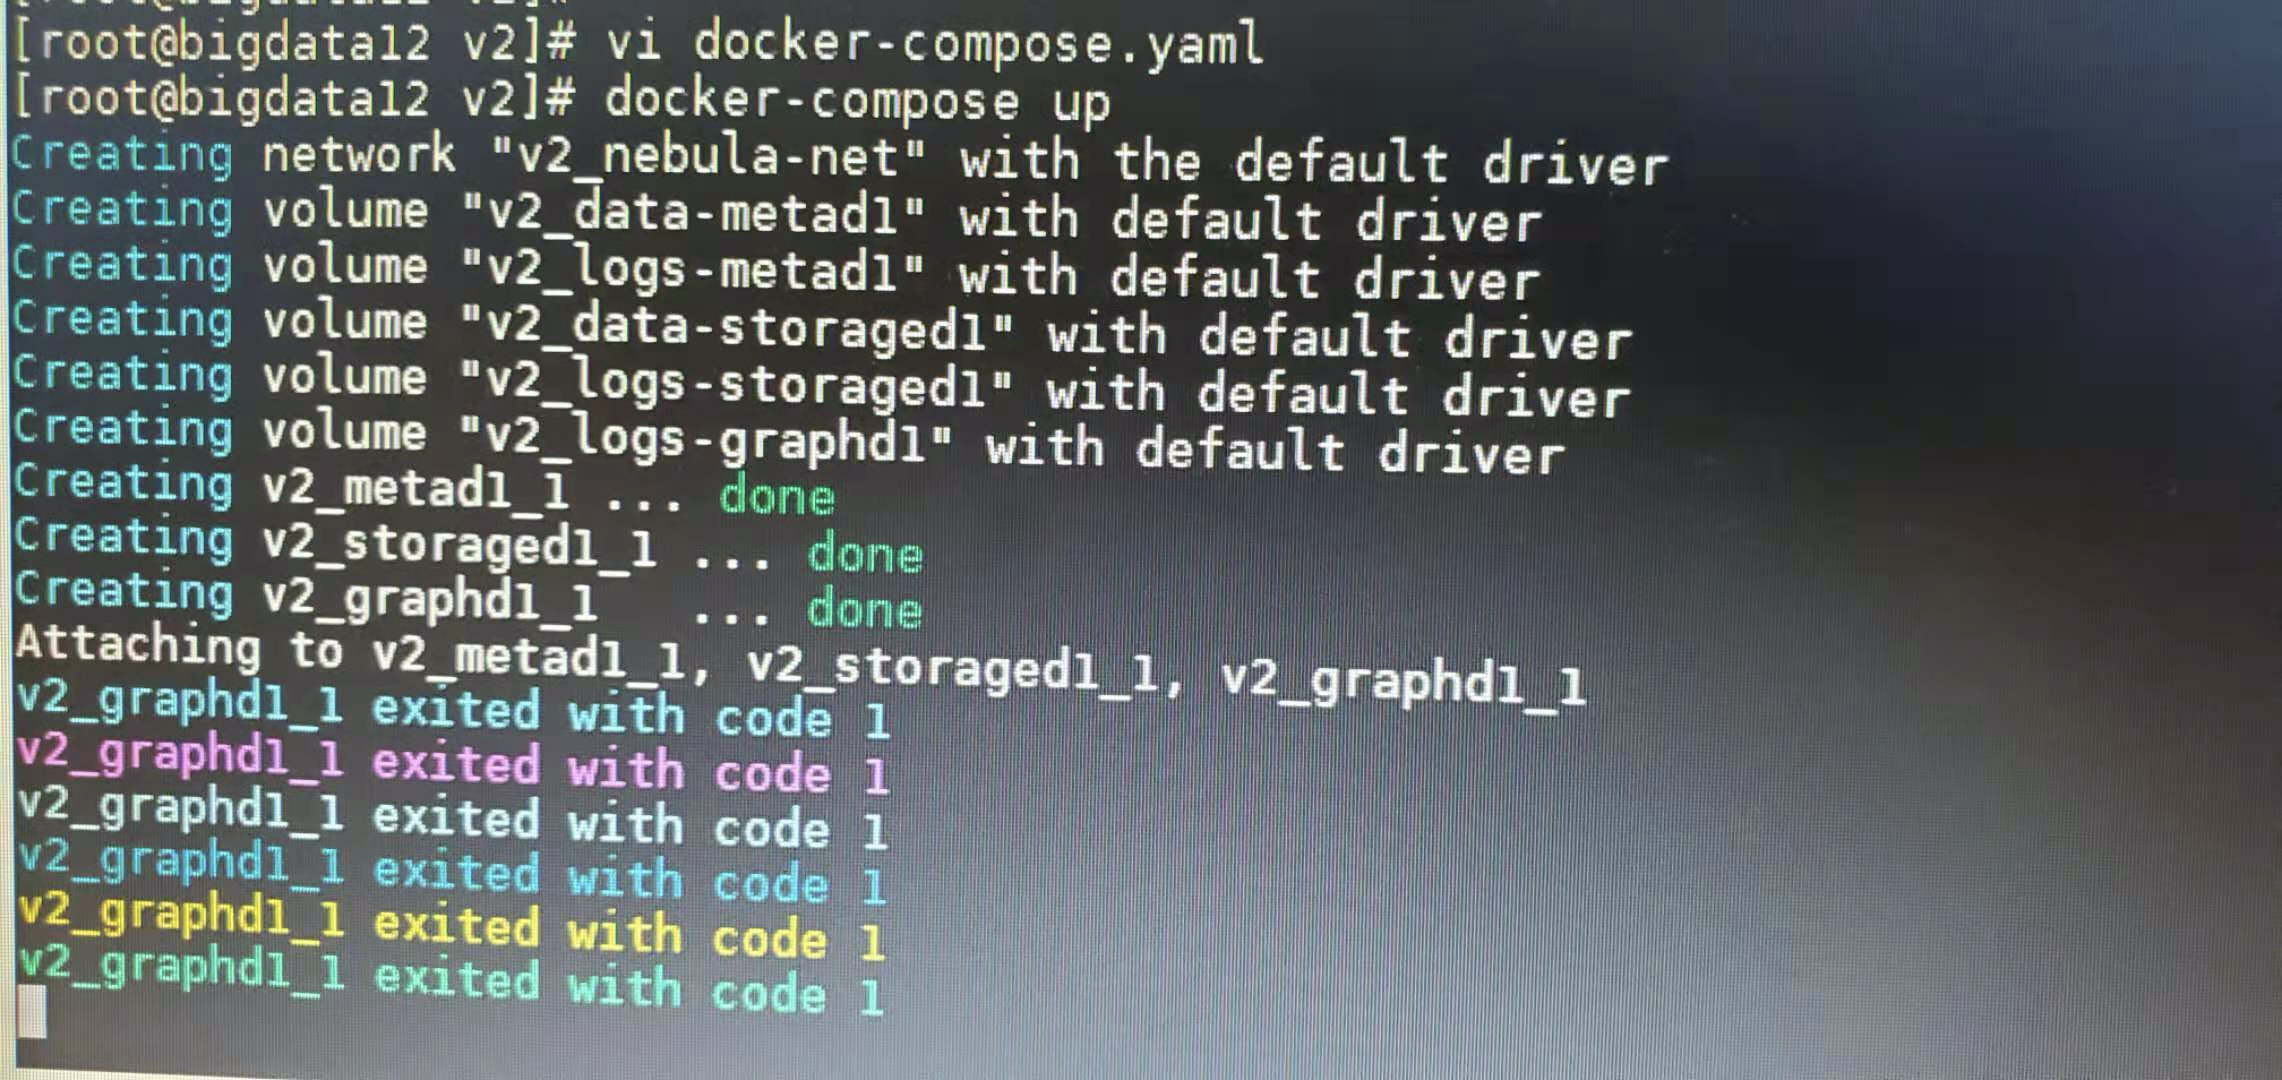
graphd在不断的exit/restarting,发现如下图红框中的内容所示
metad和storaged都正常,graphd的command不知道为什么不是./bin/nebula-graphd…
提问参考模版:
graphd在不断的exit/restarting,发现如下图红框中的内容所示
metad和storaged都正常,graphd的command不知道为什么不是./bin/nebula-graphd…
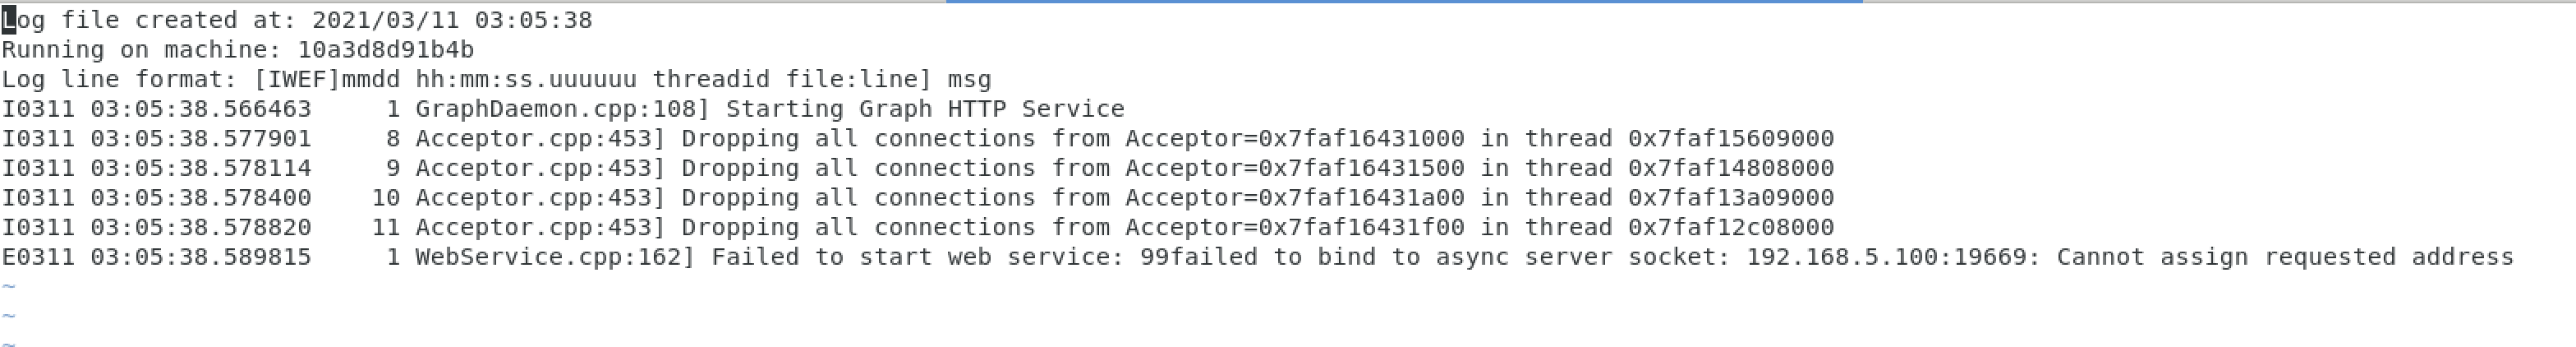
看下graph的log文件,都报什么错
docker-compose.yaml如下:
version: '3.4'
services:
  metad0:
    image: vesoft/nebula-metad:v2-nightly
    environment:
      USER: root
      TZ:   "${TZ}"
    command:
      - --meta_server_addrs=192.168.5.100:9559
      - --local_ip=192.168.5.100
      - --ws_ip=192.168.5.100
      - --port=9559
      - --ws_http_port=19559
      - --data_path=/data/meta
      - --log_dir=/logs
      - --v=0
      - --minloglevel=0
    healthcheck:
      test: ["CMD", "curl", "-sf", "http://192.168.5.100:19559/status"]
      interval: 30s
      timeout: 10s
      retries: 3
      start_period: 20s
    ports:
      - 9559
      - 19559
      - 19560
    volumes:
      - ./data/meta0:/data/meta
      - ./logs/meta0:/logs
    networks:
      - nebula-net
    restart: on-failure
    cap_add:
      - SYS_PTRACE

  storaged0:
    image: vesoft/nebula-storaged:v2-nightly
    environment:
      USER: root
      TZ:   "${TZ}"
    command:
      - --meta_server_addrs=192.168.5.100:9559
      - --local_ip=192.168.5.100
      - --ws_ip=192.168.5.100
      - --port=9779
      - --ws_http_port=19779
      - --data_path=/data/storage
      - --log_dir=/logs
      - --v=0
      - --minloglevel=0
    depends_on:
      - metad0
    healthcheck:
      test: ["CMD", "curl", "-sf", "http://192.168.5.100:19779/status"]
      interval: 30s
      timeout: 10s
      retries: 3
      start_period: 20s
    ports:
      - 9779
      - 19779
      - 19780
    volumes:
      - ./data/storage0:/data/storage
      - ./logs/storage0:/logs
    networks:
      - nebula-net
    restart: on-failure
    cap_add:
      - SYS_PTRACE

  graphd:
    image: vesoft/nebula-graphd:v2-nightly
    environment:
      USER: root
      TZ:   "${TZ}"
    command:
      - --meta_server_addrs=192.168.5.100:9559
      - --port=9669
      - --local_ip=192.168.5.100
      - --ws_ip=192.168.5.100
      - --ws_http_port=19669
      - --log_dir=/logs
      - --v=0
      - --minloglevel=0
    depends_on:
      - metad0
    healthcheck:
      test: ["CMD", "curl", "-sf", "http://192.168.5.100:19669/status"]
      interval: 30s
      timeout: 10s
      retries: 3
      start_period: 20s
    ports:
      - "9669:9669"
      - 19669
      - 19670
    volumes:
      - ./logs/graph:/logs
    networks:
      - nebula-net
    restart: on-failure
    cap_add:
      - SYS_PTRACE

networks:
nebula-net:你是不是之前还部署过单机版的服务, 然后graphd的服务没停掉?
这个路径显示是正常的, graphd的dockerfile的entrypoint用的是绝对路径, metad/storaged的dockerfile的entrypoint还没改过来, 用的还是相对路径。
哦这样,我是和v1的对比发现不一样。
请问是我的配置文件有问题吗?
你把graphd配置文件的- --local_ip那行删掉再试试?
删掉后还是同样的问题
你用sudo docker images看下graphd镜像的时间, 是不是太旧了, 需要用sudo docker image pull vesoft/nebula-graphd:v2-nightly更新下。
都是两天前的
除了这个问题之外,想请教一下如何从v1升级到v2。
服务器上的是docker swarm部署的nebula,除了做数据迁移balance data外,只需要改动docker-stack.yml里的镜像版本吗还是所有的port也需要改成v2的版本?
更新:
改用docker swarm方式可以成功部署,参考v1的yaml文件github
配置文件如下:
version: '3.6'
services:
  metad0:
image: vesoft/nebula-metad:v2-nightly
env_file:
  - ./nebula.env
command:
  - --meta_server_addrs=192.168.5.100:45500,
  - --local_ip=192.168.5.100
  - --ws_ip=192.168.5.100
  - --port=45500
  - --ws_http_port=11000
  - --data_path=/data/meta
  - --log_dir=/logs
  - --v=0
  - --minloglevel=0
deploy:
  replicas: 1
  restart_policy:
    condition: on-failure
  placement:
    constraints:
      - node.hostname == java-env
healthcheck:
  test: ["CMD", "curl", "-f", "http://192.168.5.100:11000/status"]
  interval: 30s
  timeout: 10s
  retries: 3
  start_period: 20s
ports:
  - target: 11000
    published: 11000
    protocol: tcp
    mode: host
  - target: 11002
    published: 11002
    protocol: tcp
    mode: host
  - target: 45500
    published: 45500
    protocol: tcp
    mode: host
volumes:
  - data-metad0:/data/meta
  - logs-metad0:/logs
networks:
  - nebula-net
  storaged0:
image: vesoft/nebula-storaged:v2-nightly
env_file:
  - ./nebula.env
command:
  - --meta_server_addrs=192.168.5.100:45500
  - --local_ip=192.168.5.100
  - --ws_ip=192.168.5.100
  - --port=44500
  - --ws_http_port=12000
  - --data_path=/data/storage
  - --log_dir=/logs
  - --v=0
  - --minloglevel=0
deploy:
  replicas: 1
  restart_policy:
    condition: on-failure
  placement:
    constraints:
      - node.hostname == java-env
depends_on:
  - metad0
healthcheck:
  test: ["CMD", "curl", "-f", "http://192.168.5.100:12000/status"]
  interval: 30s
  timeout: 10s
  retries: 3
  start_period: 20s
ports:
  - target: 12000
    published: 12000
    protocol: tcp
    mode: host
  - target: 12002
    published: 12002
    protocol: tcp
    mode: host
volumes:
  - data-storaged0:/data/storage
  - logs-storaged0:/logs
networks:
  - nebula-net


  graphd0:
image: vesoft/nebula-graphd:v2-nightly
env_file:
  - ./nebula.env
command:
  - --meta_server_addrs=192.168.5.100:45500
  - --port=3699
  - --ws_http_port=13000
  - --ws_ip=192.168.5.100
  - --log_dir=/logs
  - --v=0
  - --minloglevel=0
deploy:
  replicas: 1
  restart_policy:
    condition: on-failure
  placement:
    constraints:
      - node.hostname == java-env
depends_on:
  - metad0
healthcheck:
  test: ["CMD", "curl", "-f", "http://192.168.5.100:13000/status"]
  interval: 30s
  timeout: 10s
  retries: 3
  start_period: 20s
ports:
  - target: 3699
    published: 3699
    protocol: tcp
    mode: host
  - target: 13000
    published: 13000
    protocol: tcp
    mode: host
  - target: 13002
    published: 13002
    protocol: tcp
    mode: host
volumes:
  - data-storaged0:/data/storage
  - logs-storaged0:/logs
networks:
  - nebula-net

networks:
  nebula-net:
external: true
attachable: true
name: host
volumes:
  data-metad0:
  logs-metad0:
  data-storaged0:
  logs-storaged0:
  logs-graphd0:
问题描述:现有一台graph 启动失败,其余两台graph 正常启动。目前该三台机器上各有nebula1.2服务存在。
日志显示:
Log file created at: 2021/03/11 16:12:33
Running on machine: nebula-server-backup-2
Log line format: [IWEF]mmdd hh:mm:ss.uuuuuu threadid file:line] msg
E0311 16:12:33.039363 22898 GraphDaemon.cpp:70] Process `6794' already existed
查看进程号发现并不存在
[root@nebula-server-backup-2 logs]# ps aux | grep 6794
root     27427  0.0  0.0 112812   972 pts/1    S+   16:20   0:00 grep --color=auto 6794
[root@nebula-server-backup-2 logs]# ll /proc | grep 6794
附上graph配置文件信息
########## basics ##########
# Whether to run as a daemon process
--daemonize=true
# The file to host the process id
--pid_file=pids/nebula-graphd.pid
# Whether to enable optimizer
--enable_optimizer=true

########## logging ##########
# The directory to host logging files, which must already exists
--log_dir=logs
# Log level, 0, 1, 2, 3 for INFO, WARNING, ERROR, FATAL respectively
--minloglevel=0
# Verbose log level, 1, 2, 3, 4, the higher of the level, the more verbose of the logging
--v=0
# Maximum seconds to buffer the log messages
--logbufsecs=0
# Whether to redirect stdout and stderr to separate output files
--redirect_stdout=true
# Destination filename of stdout and stderr, which will also reside in log_dir.
--stdout_log_file=graphd-stdout.log
--stderr_log_file=graphd-stderr.log
# Copy log messages at or above this level to stderr in addition to logfiles. The numbers of severity levels INFO, WARNING, ERROR, and FATAL are 0, 1, 2, and 3, respectively.
--stderrthreshold=2

########## query ##########
# Whether to treat partial success as an error.
# This flag is only used for Read-only access, and Modify access always treats partial success as an error.
--accept_partial_success=false

########## networking ##########
# Comma separated Meta Server Addresses
--meta_server_addrs=10.0.7.139:9559,10.0.7.140:9559,10.0.7.141:9559
# Local IP used to identify the nebula-graphd process.
# Change it to an address other than loopback if the service is distributed or
# will be accessed remotely.
--local_ip=10.0.7.140
# Network device to listen on
--listen_netdev=any
# Port to listen on
--port=9669
# To turn on SO_REUSEPORT or not
--reuse_port=false
# Backlog of the listen socket, adjust this together with net.core.somaxconn
--listen_backlog=1024
# Seconds before the idle connections are closed, 0 for never closed
--client_idle_timeout_secs=0
# Seconds before the idle sessions are expired, 0 for no expiration
--session_idle_timeout_secs=60000
# The number of threads to accept incoming connections
--num_accept_threads=1
# The number of networking IO threads, 0 for # of CPU cores
--num_netio_threads=0
# The number of threads to execute user queries, 0 for # of CPU cores
--num_worker_threads=0
# HTTP service ip
--ws_ip=0.0.0.0
# HTTP service port
--ws_http_port=19669
# HTTP2 service port
--ws_h2_port=19670

# Heartbeat interval of communication between meta client and graphd service
--heartbeat_interval_secs=10

########## authorization ##########
# Enable authorization
--enable_authorize=false

########## authentication ##########
# User login authentication type, password for nebula authentication, ldap for ldap authentication, cloud for cloud authentication
--auth_type=password
我把pids目录下的nebula-graphd.pid 删了重新启动就可以了