提问参考模版:
- nebula 版本:2.0ga
- 部署方式(分布式 / 单机 / Docker / DBaaS):分布式
- 硬件信息
- 问题的具体描述
- 相关的 meta / storage / graph info 日志信息
参考https://github.com/vesoft-inc/nebula-stats-exporter通过nebula-stats-exporter进行配置的prometheus和grafana监控。
但是只有nebula_graphd_count、nebula_metad_count、nebula_storaged_count三个监控数据,没有其他的监控数据。
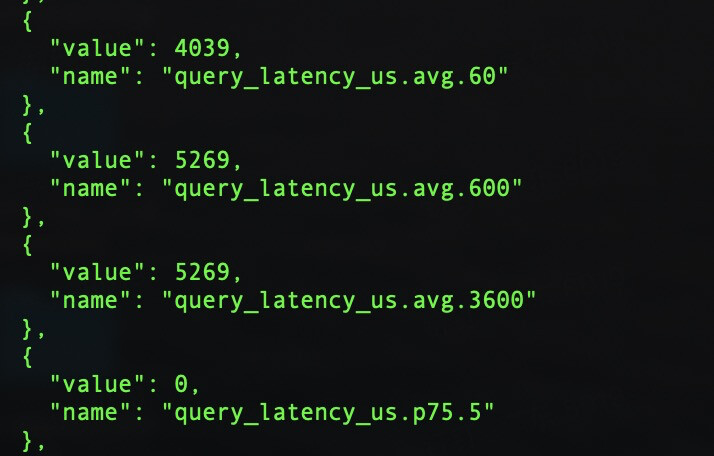
通过 curl -G "
http://xx:19669/stats?stats&format=json"能够获得。
现在版本只开放这几个统计数据,以后会慢慢增加的。
num_queries; num_slow_queries; num_query_errorss; query_latency_us; slow_query_latency_us;
1 个赞
我在prometheus的targets里怎么没有找到这些统计数据啊?
@lidong 看了 nebula-stats-exporter 的代码,应该还没适配好对接nebula-graph2.0的指标,你可以先通过命令拿到指标。
@kevin.qiao 麻烦你确认下 nebula-stats-exporter 是否已经对接好2.0的指标。
1 个赞
grafana那里没有做2.0的调整,exporter的指标是对接了2.0的
近期我们会推出自己的监控面板,grafana的配置会逐步移除掉,如果你急需要使用,我可以提供一份配置给你
好的,我需要配置测试一下,会尽快给到你这边,还请耐心等待
3 个赞
nebula-1617737051977.json (16.8 KB)
2.0 nebula的监控指标做了重构,如果有特殊查询,你可以从storage的指标那里获取
1 个赞
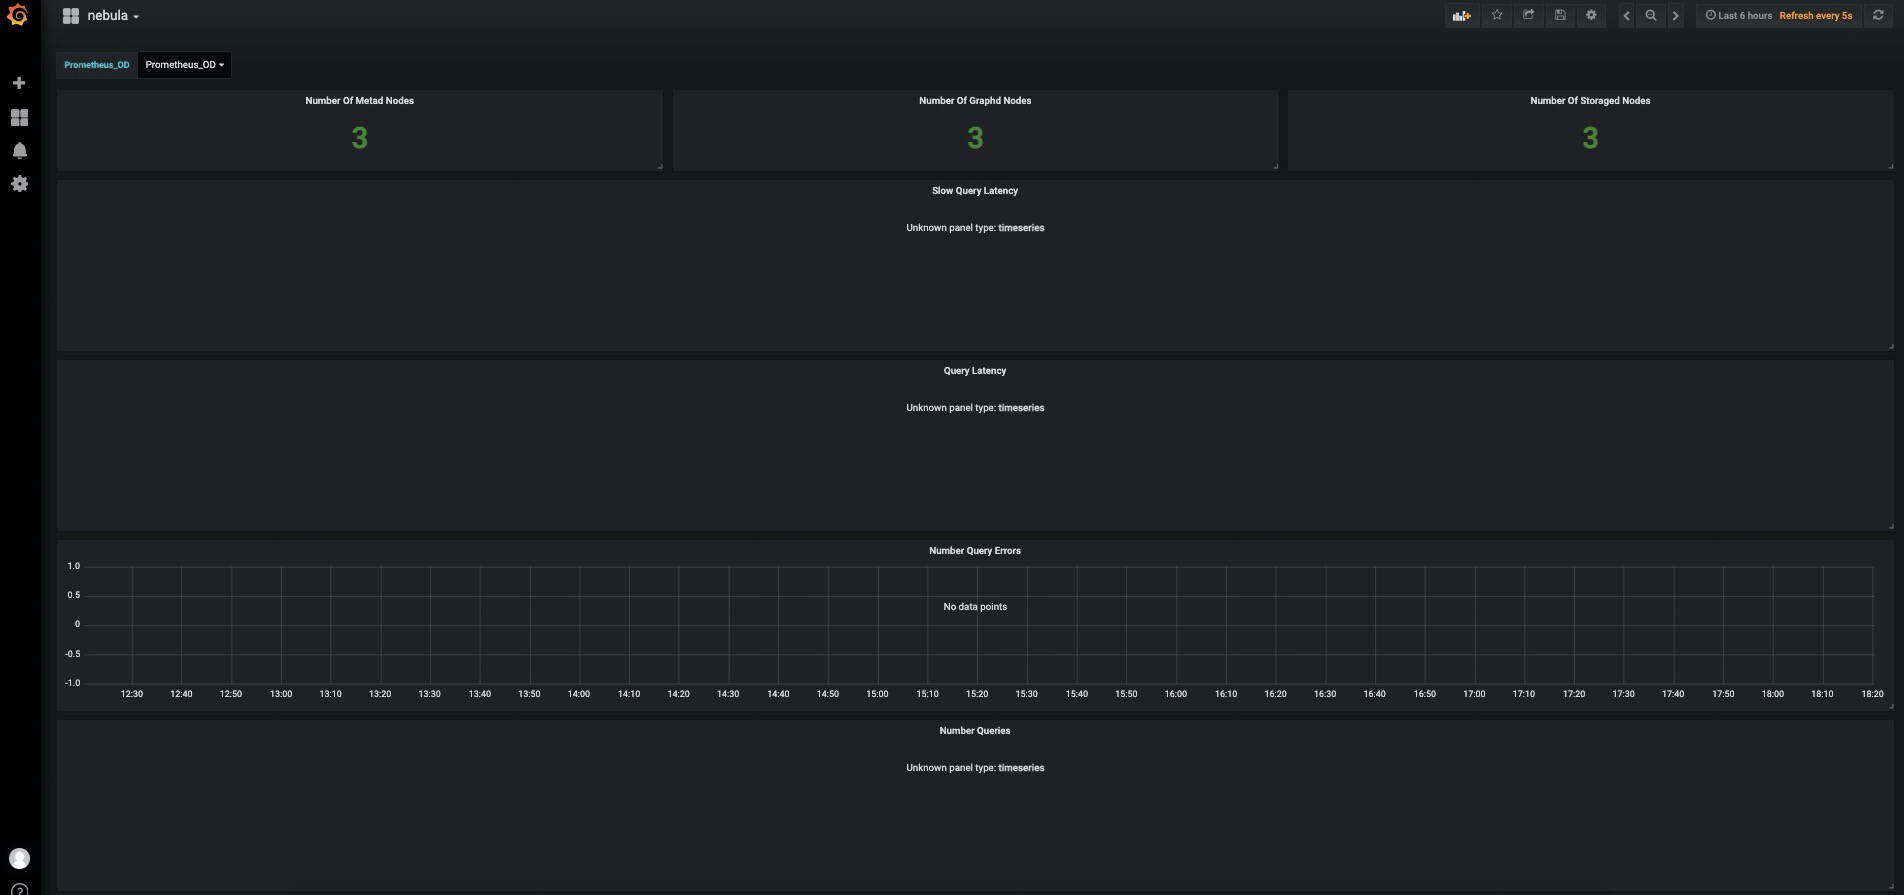
按照这个json更新了grafana的dashboard的json,但还是没有数据啊。
查看prometheus的targets,并没有上述指标:num_queries; num_slow_queries; num_query_errorss; query_latency_us; slow_query_latency_us;
我使用方式有误吗?
@kevin.qiao 界面的指标怎么还是1.0的
exporter的镜像使用docker pull vesoft/nebula-stats-exporter:v0.0.3,这个是针对nebula 2.0编译的,github 上pr还没合入,更新延后了
docker pull vesoft/nebula-stats-exporter:v0.0.3
docker run -d --restart=always -p 9100:9100 -v {absolute directory of config.yaml}:/config
vesoft/nebula-stats-exporter:v0.0.2 --bare-metal --bare-metal-config-path=/config/config.yaml
v0.0.3版本,还有啥需要修改的配置吗?我启动镜像后一直在restart 报错啊
nebula-stats-exporter: error: unknown long flag ‘–bare-metal-config-path’, try --help
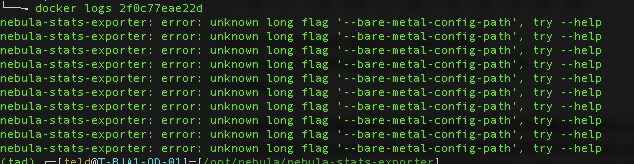
docker run 现在没这个参数了吗?–bare-metal-config-path
参数修改了
docker run -d --restart=always -p 9100:9100 -v {directory to config.yaml}:/config \
 vesoft/nebula-stats-exporter:v0.0.3  --bare-metal --bare-metal-config=/config/config.yaml
config.yaml中字段也有更改,nebulaType 改成componentType了
可以运行了,但是查看prometheus的targets,还是没有上述指标:num_queries; num_slow_queries; num_query_errorss; query_latency_us; slow_query_latency_us;
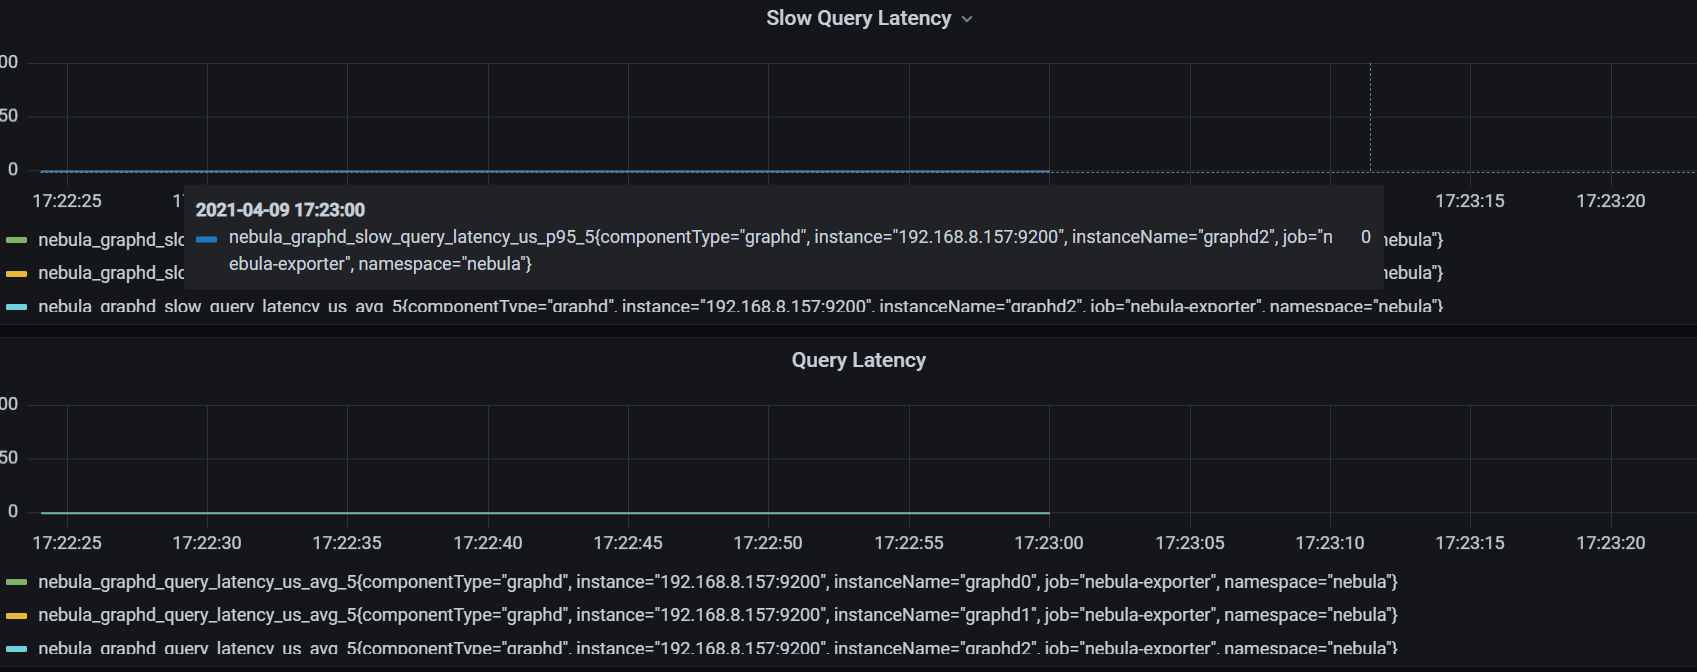
grafana使用你提供的json,也是没有数值。
放弃了,不折腾了。我根据curl -G "http://:19669/stats?stats&format=json"的结果,写个工具转存到influxdbba
你这个截图里的dashboard先删除掉,重新导入我上传的文件
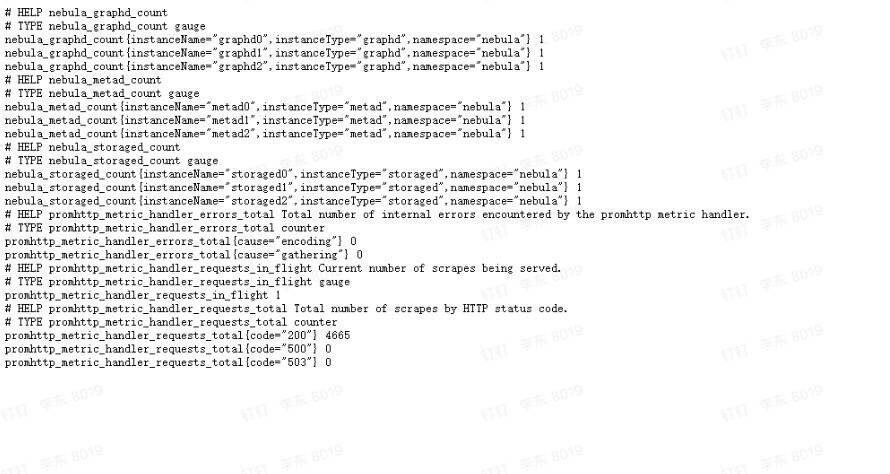
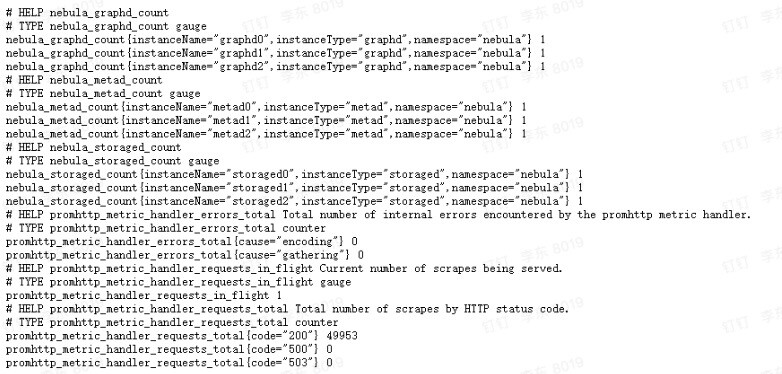
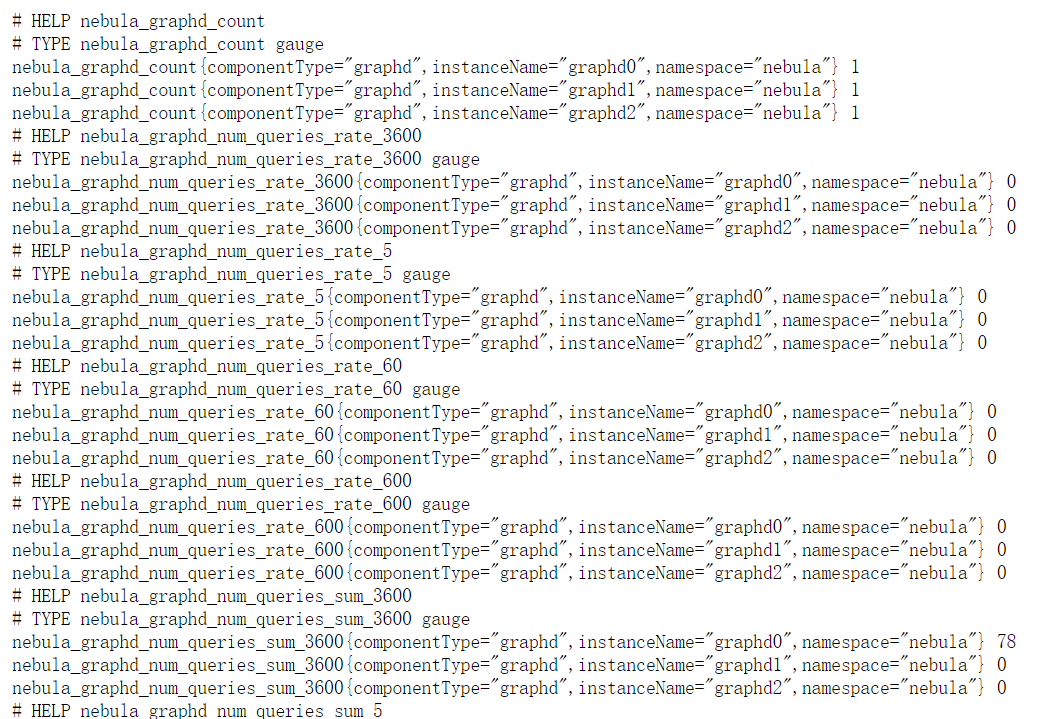
prometheus的里的methics是这样的
exporter的metrics接口请求
http://IP:9100/metrics 输出是什么,还麻烦你贴出来看看
重新倒入json,有数据了,但是我们生产的grafana版本太低了,有些图没有。算啦算啦,我还是自己写脚本写入influxdb吧。感谢感谢
└──╼ curl -G “
http://192.168.0.97:9100/metrics”
HELP nebula_graphd_count
TYPE nebula_graphd_count gauge
nebula_graphd_count{componentType=“graphd”,instanceName=“graphd0”,namespace=“nebula”} 1
nebula_graphd_count{componentType=“graphd”,instanceName=“graphd1”,namespace=“nebula”} 1
nebula_graphd_count{componentType=“graphd”,instanceName=“graphd2”,namespace=“nebula”} 1
HELP nebula_metad_count
TYPE nebula_metad_count gauge
nebula_metad_count{componentType=“metad”,instanceName=“metad0”,namespace=“nebula”} 1
nebula_metad_count{componentType=“metad”,instanceName=“metad1”,namespace=“nebula”} 1
nebula_metad_count{componentType=“metad”,instanceName=“metad2”,namespace=“nebula”} 1
HELP nebula_storaged_count
TYPE nebula_storaged_count gauge
nebula_storaged_count{componentType=“storaged”,instanceName=“storaged0”,namespace=“nebula”} 1
nebula_storaged_count{componentType=“storaged”,instanceName=“storaged1”,namespace=“nebula”} 1
nebula_storaged_count{componentType=“storaged”,instanceName=“storaged2”,namespace=“nebula”} 1
HELP promhttp_metric_handler_errors_total Total number of internal errors encountered by the promhttp metric handler.
TYPE promhttp_metric_handler_errors_total counter
promhttp_metric_handler_errors_total{cause=“encoding”} 0
promhttp_metric_handler_errors_total{cause=“gathering”} 0
HELP promhttp_metric_handler_requests_in_flight Current number of scrapes being served.
TYPE promhttp_metric_handler_requests_in_flight gauge
promhttp_metric_handler_requests_in_flight 1
HELP promhttp_metric_handler_requests_total Total number of scrapes by HTTP status code.
TYPE promhttp_metric_handler_requests_total counter
promhttp_metric_handler_requests_total{code=“200”} 445
promhttp_metric_handler_requests_total{code=“500”} 0
promhttp_metric_handler_requests_total{code=“503”} 0