- nebula 版本 nebualGraph 2.5.0 和spark -exchange 2.5.0
- 部署方式 rpm分布式
- 是否为线上版本:Y
- 硬件信息
- 磁盘( SSD)
- CPU32c、64G内存信息
- 问题的具体描述
相同配置nebualGraph 2.5.0 和spark -exchange 2.5.0 导入hive数据速度比2.0.0 导入慢很多
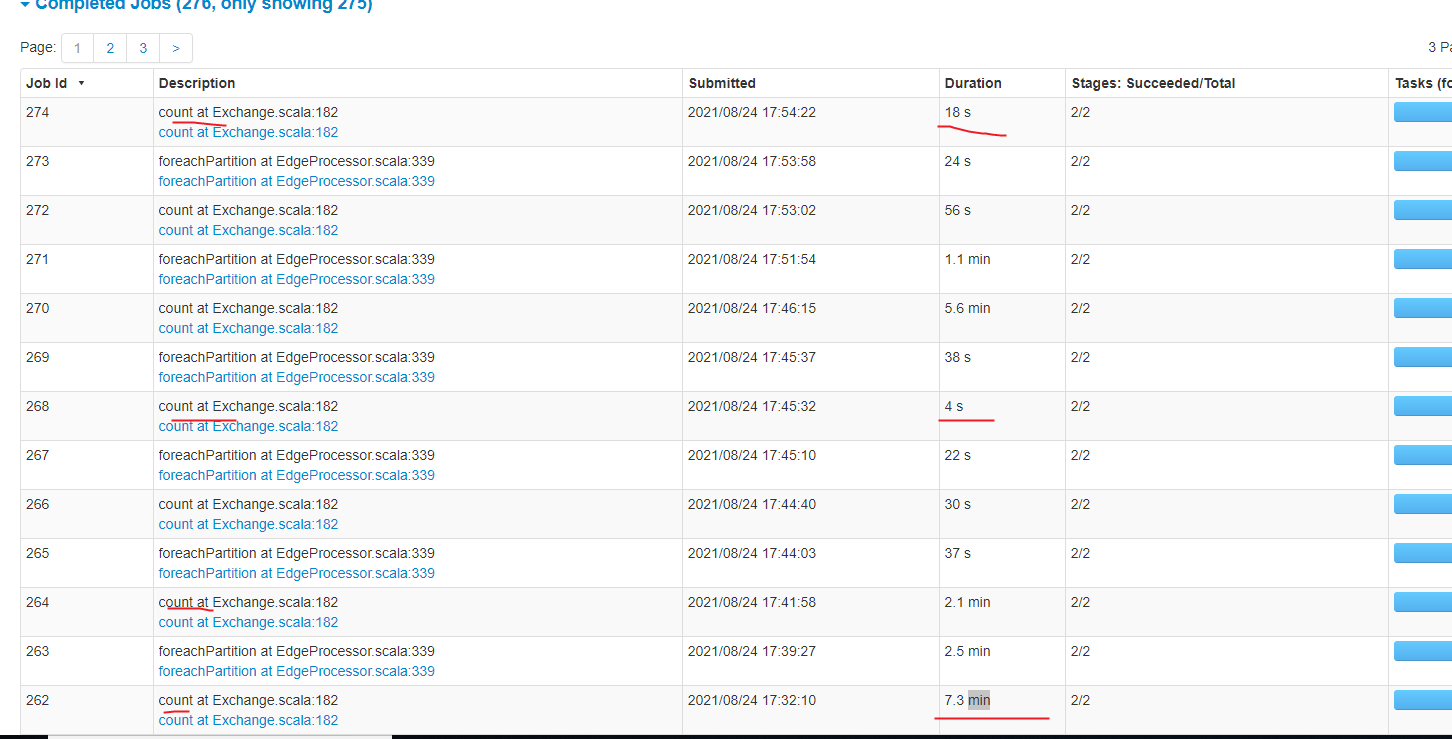
现在出现很多count任务耗时也很多,之前2.0.0是没有count 任务的,现在怎么越升级越慢了啊??
之前遇到相似的问题,一般是配置相关的原因,你把两个版本的配置信息都贴一下
${SPARK_HOME}/bin/spark-submit
–queue root.ipd.daily
–name “nebula2.0-import-$taskName”
–master yarn
–driver-cores 26
–driver-memory 32g
–executor-memory 32g
–deploy-mode cluster
–num-executors 48
–executor-cores 20
–conf spark.port.maxRetries=3
–conf spark.yarn.maxAppAttempts=3
–conf spark.executor.memoryOverhead=8g
–conf spark.driver.memoryOverhead=8g
–conf spark.hadoop.fs.defaultFS="$ALG_HDFS"
–conf spark.default.parallelism=48
–conf spark.executor.extraJavaOptions="-XX:MaxDirectMemorySize=7372m"
–files “$nebulaConf”
–class com.vesoft.nebula.exchange.Exchange
${baseJarPath}/nebula-exchange-2.5.0.jar -c nebula-import.conf -h -d
}
{
Spark 相关信息配置
参见: http://spark.apache.org/docs/latest/configuration.html
spark: {
app: {
name: Spark Writer
}
driver: {
  cores: 16
  maxResultSize: 16G
}

cores {
  max: 16
}
}
Nebula Graph 相关信息配置
nebula: {
# 查询引擎 IP 列表
address: {
graph: ["{{ graph | join(’", “’) }}”]
meta: ["{{ meta | join(’", “’) }}”]
}
# 连接 Nebula Graph 服务的用户名和密码
user: {{ user }}
pswd: {{ password }}

# Nebula Graph 图空间名称
space: {{ space }}

# thrift 超时时长及重试次数
# 如未设置,则默认值分别为 3000 和 3
connection {
  timeout: 10000000
  retry: 10
}

# nGQL 查询重试次数
# 如未设置,则默认值为 3
execution {
  retry: 10
}
error: {
  max: 32
  output: /tmp/errors
}
rate: {
  limit: 1024
  timeout: 10000000
}
}
处理标签
tags: [
# 与上述类似
# 从 Hive 加载将执行命令 $ {exec} 作为数据集
{% for vertex in vertex_list %}{
name: {{ vertex[‘name’] }}
type: {
source: hive
sink: client
}
exec: “select {{ (([vertex[‘id_name’]] | list) + vertex[‘hive_fields’]) | join(’, ') }} from {{ vertex[‘table’] }} where ds = ‘{{ vertex[‘ds’] }}’”
fields: [{{ vertex[‘hive_fields’] | join(’, ‘) }}]
nebula.fields: [{{ vertex[‘nebula_fields’] | join(’, ') }}]
vertex: {{ vertex[‘id_name’] }}
isImplicit: true
batch: 384
partition: 48
}
{% endfor %}
]
处理边
edges: [
# 从 Hive 加载将执行命令 $ {exec} 作为数据集
# 边权重为可选
{% for edge in edge_list %}{
name: {{ edge[‘name’] }}
type: {
source: hive
sink: client
}
exec: “select {{ (([edge[‘source_id’], edge[‘target_id’]] | list) + edge[‘hive_fields’]) | join(’, ') }} from {{ edge[‘table’] }} where ds = ‘{{ edge[‘ds’] }}’ and edge_label = ‘{{ edge[‘name’] }}’”
fields: [{{ edge[‘hive_fields’] | join(’, ‘) }}]
nebula.fields: [{{ edge[‘nebula_fields’] | join(’, ') }}]
source: {{ edge[‘source_id’] }}
target: {{ edge[‘target_id’] }}{% if edge[‘rank’] %}
ranking: {{ edge[‘rank’] }}{% endif %}
isImplicit: true
batch: 384
partition: 48
}
{% endfor %}
]
}
都一样的配置,知识exchange jar版本不一样
关键是现在出现很多count任务耗时也很多,之前2.0.0是没有count 任务的,这个到底是干嘛的可以去掉吗
count是为了辅助进行数据统计和导入时间计算的, 你可以用master分支的代码进行编译,不需要统计信息的话可以去掉的。
count 需要去掉耗时是导入一半时间,还有这个统计在哪里体现查询看到啊,如果用户看不到,这个就没必要了,太浪费时间了
还有这个能帮打个去掉count ,打个包发我吗,我不熟悉代码不知道改哪里,谢谢啦
在日志里面看的, 你稍后可以用2.5-SNAPSHOT版本, 目前还没发哈
什么时候发啊,这边已经升级2.5.0开始测试了,
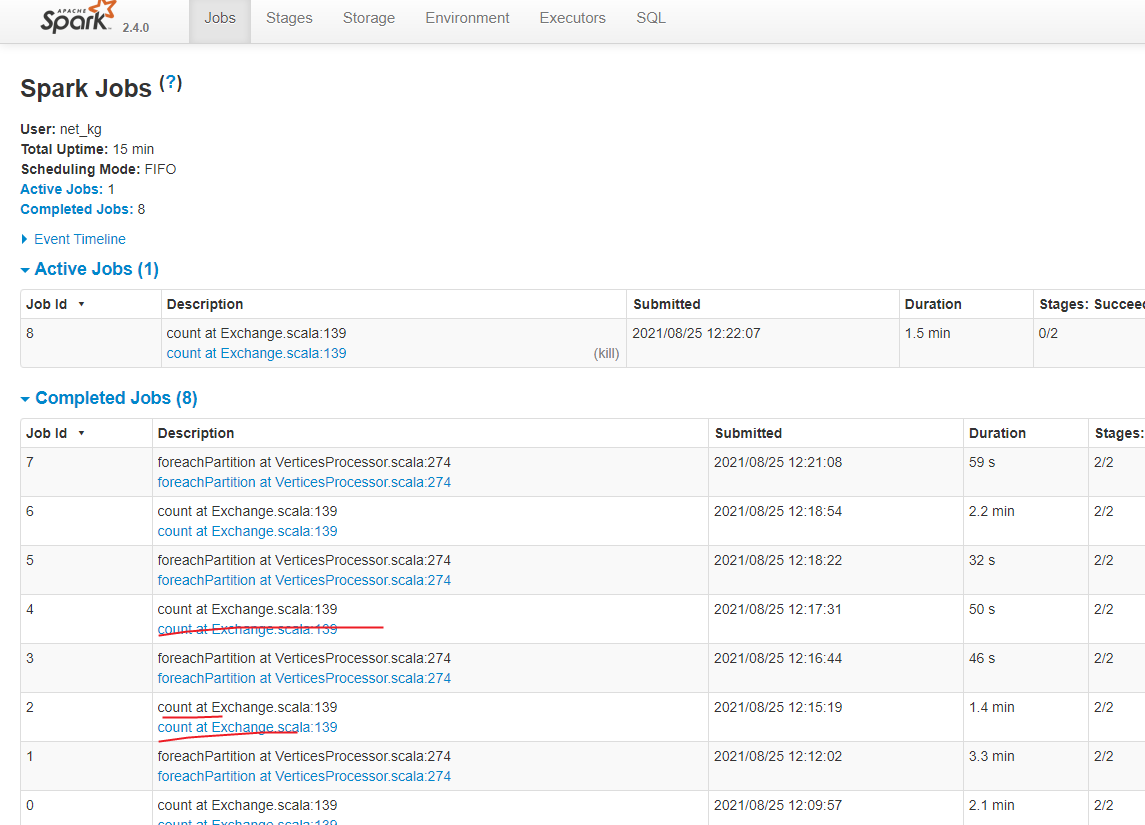

这个count在没关系,有cache 不会重复做数据读取的。 这里实际上多消耗的时间是做count统计的时间,你在jobs中看到的会把count之前的transform操作的时间都统计进去的