Dashboard nebula-graph-dashboard 无法登陆
- nebula 版本:2.5
- Dashboard版本: 1.0.1
- 部署方式(分布式 / 单机 / Docker / DBaaS):集群
- 是否为线上版本:N
- Dashboard部署参考文档(官网):部署Dashboard - NebulaGraph Database 手册
问题描述
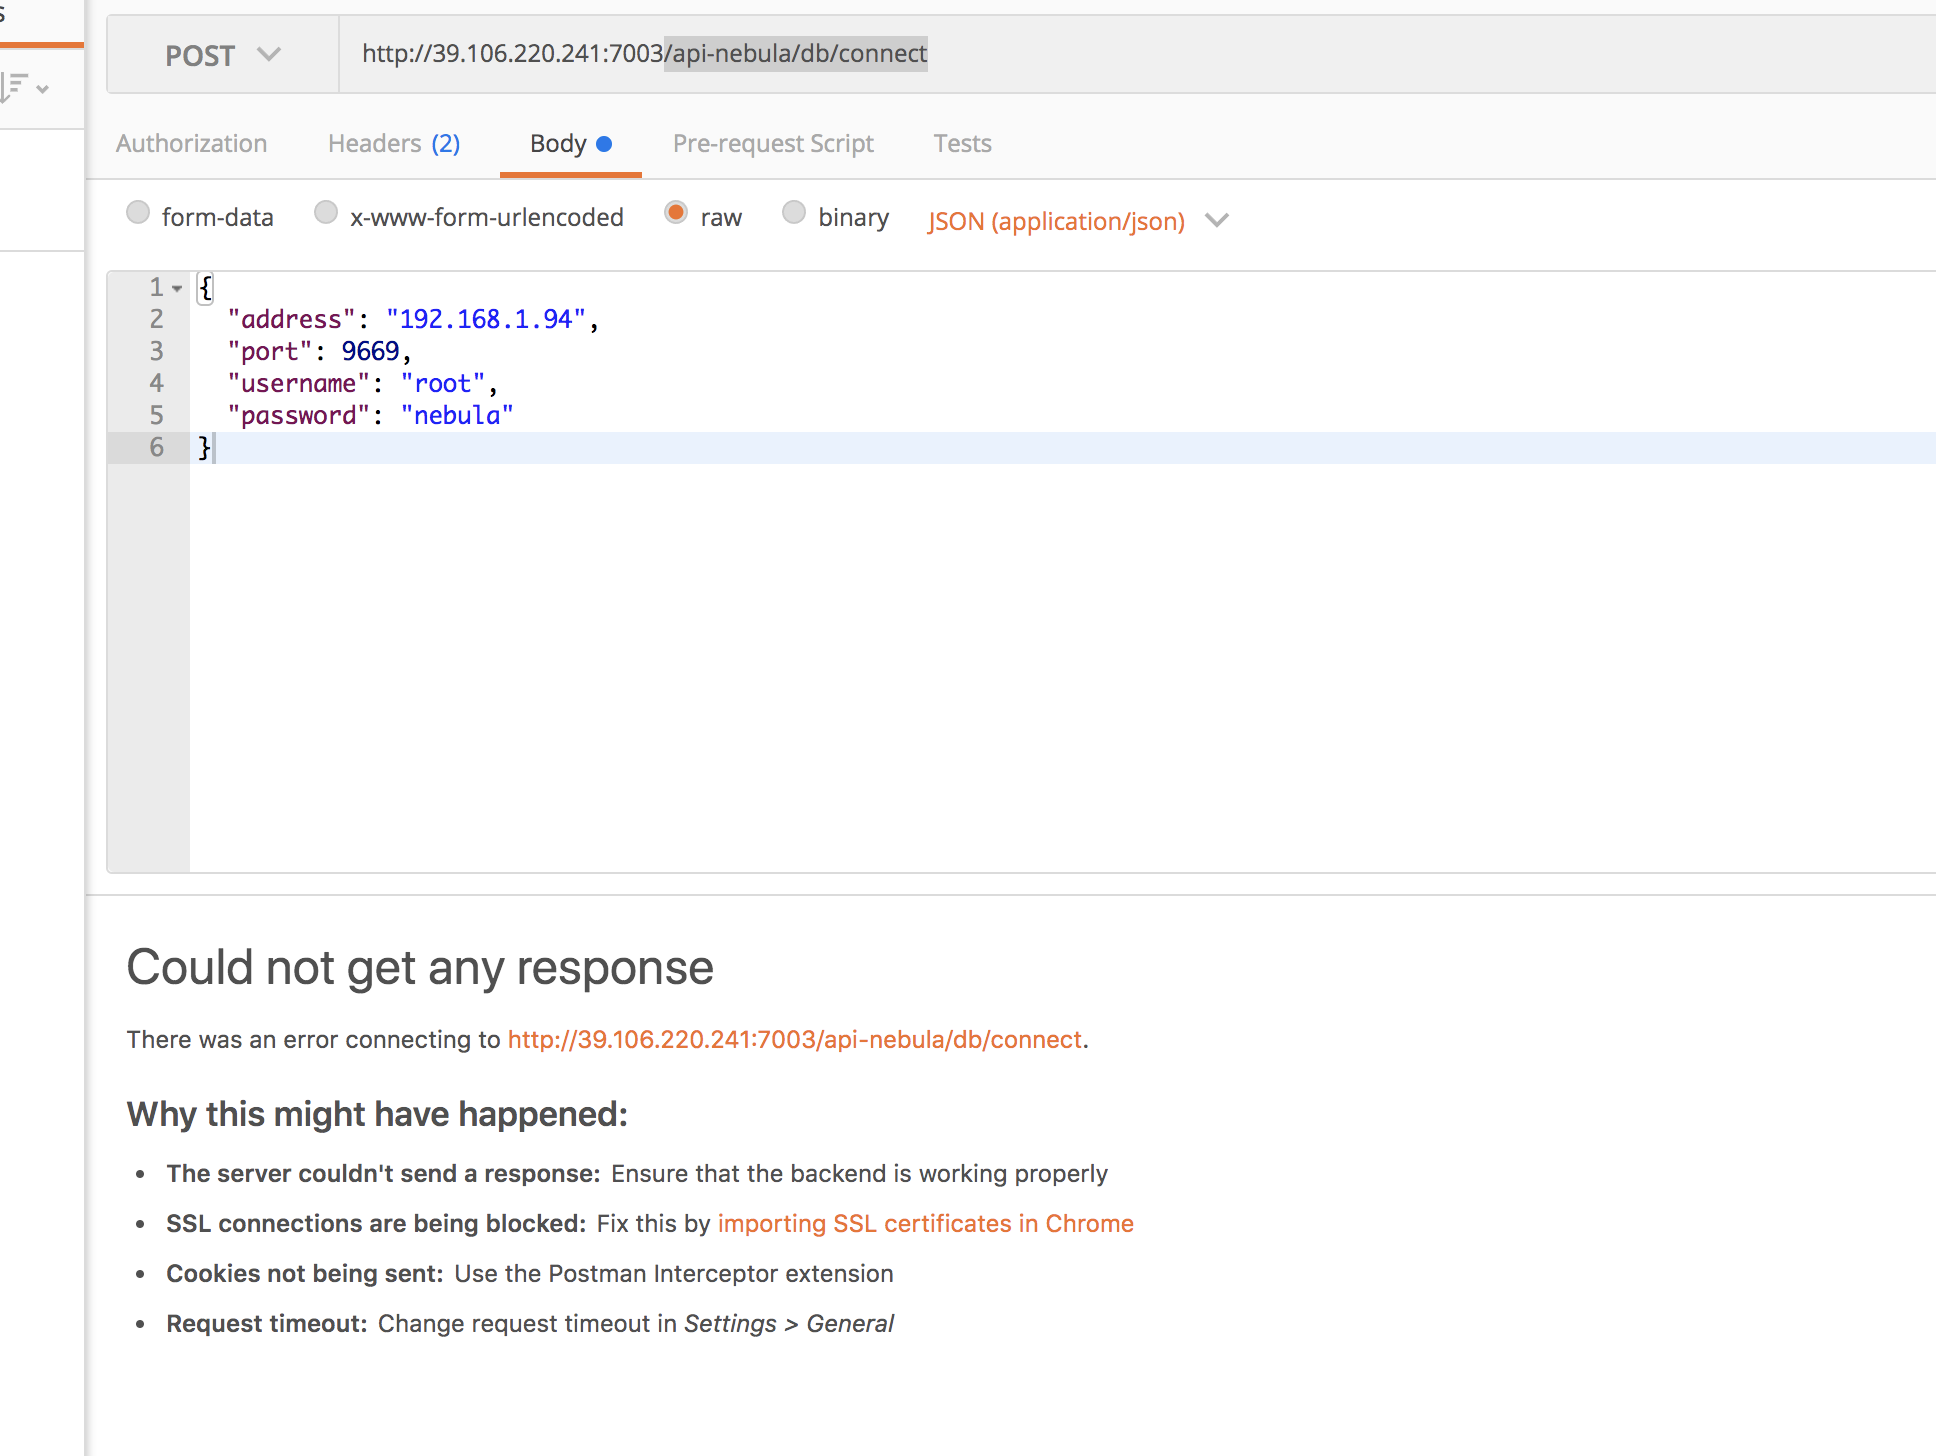
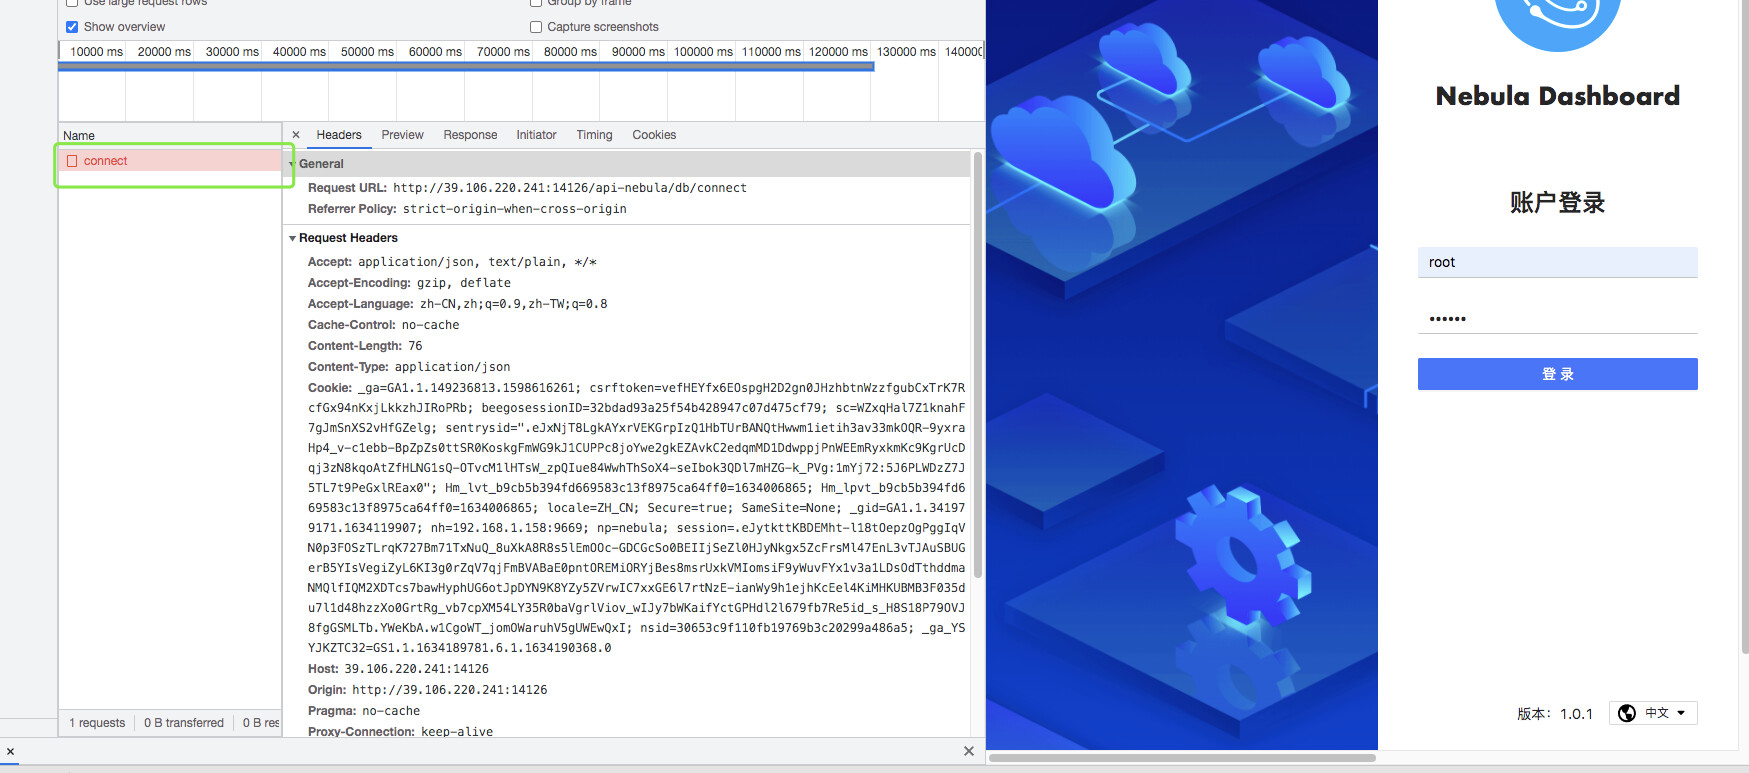
Network连接错误,/api-nebula/db/connect接口报错,其他服务网页都有显示
其它服务配置
nebula-stats-exporter
version: v0.0.2
nebulaItems:
  - instanceName: metad0
    endpointIP: 192.168.1.94
    endpointPort: 19559
    componentType: metad
  - instanceName: metad1
    endpointIP: 192.168.1.158
    endpointPort: 19559
    componentType: metad
  - instanceName: metad2
    endpointIP: 192.168.1.159
    endpointPort: 19559
    componentType: metad
  - instanceName: graphd0
    endpointIP: 192.168.1.94
    endpointPort: 19669
    componentType: graphd
  - instanceName: graphd1
    endpointIP: 192.168.1.158
    endpointPort: 19669
    componentType: graphd
  - instanceName: graphd2
    endpointIP: 192.168.1.159
    endpointPort: 19669
    componentType: graphd
  - instanceName: storaged0
    endpointIP: 192.168.1.94
    endpointPort: 19779
    componentType: storaged
  - instanceName: storaged1
    endpointIP: 192.168.1.158
    endpointPort: 19779
    componentType: storaged
  - instanceName: storaged2
    endpointIP: 192.168.1.159
    endpointPort: 19779
    componentType: storaged
prometheus
global:
  scrape_interval:     5s
  evaluation_interval: 5s
scrape_configs:
  - job_name: 'node-exporter'
    static_configs:
      - targets: [
          '192.168.1.94:9100', # your node-exporter metrics endpoints
          '192.168.1.158:9100',
          '192.168.1.159:9100'
        ]
  - job_name: 'nebula-stats-exporter'
    static_configs:
      - targets: [
         '127.0.0.1:9200',  # nebula-stats-exporter metrics endpoints
        ]
nebula-graph-dashboard
{
    "connection": {
        "ip": "192.168.1.94",
        "port": 9669
    },
    "alias": {
        "ip:port": "instance1"
    },
    "chartBaseLine": {

    }
}