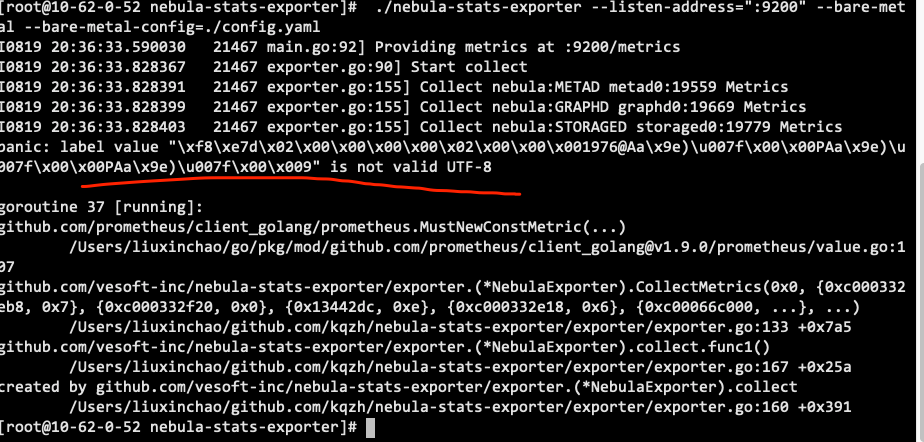
dashboard社区版(1.1.1版本)的nebula-stat服务启动失败,修改配置文件后启动,报:
goroutine 37 [running]:github.com/prometheus/client_golang/prometheus.MustNewConstMetric(...) github.com/vesoft-inc/nebula-stats-exporter/exporter.(*NebulaExporter).CollectMetrics (0x0, {0xc000332eb8, 0x7}, {0xc000332f20, 0x0}, {0x13442dc, 0xe}, {0xc000332e18, 0x6}, {0xc00066c000, …}, …)github.com/vesoft-inc/nebula-stats-exporter/exporter.(*NebulaExporter).collect.func1() github.com/vesoft-inc/nebula-stats-exporter/exporter.(*NebulaExporter).collect
kqzh
2022 年8 月 22 日 06:00
2
你好,可以贴一下exporter config.yaml的配置吗,看起来是配置里有特殊字符引起的
[root@10-62-0-52 nebula-stats-exporter]# cat config.yaml
name: nebula
name: metad0
name: graphd0
name: storaged0
kqzh
2022 年8 月 22 日 08:09
5
可以换成这个格式的配置试试?为本地测了下是没问题的
clusters:
  - name: nebula
    instances:
      - name: metad0
        endpointIP: 10.62.0.52
        endpointPort: 19559
        componentType: metad
opened 04:04PM - 24 Feb 21 UTC
closed 07:38PM - 03 Mar 21 UTC
bug
Disclaimer: I always find the weirdest bugs and apologize in advance. :)
### … Host operating system: output of `uname -a`
Linux hho 5.10.18 #3 SMP Wed Feb 24 14:19:12 CET 2021 x86_64 AMD Ryzen 7 PRO 4750U with Radeon Graphics AuthenticAMD GNU/Linux
### node_exporter version: output of `node_exporter --version`
node_exporter, version 1.1.1 (branch: non-git, revision: 4e837d4)
build user: portage@localhost
build date: 20210223-15:25:02
go version: go1.16
platform: linux/amd64
### node_exporter command line flags
--collector.textfile.directory=/run/node_exporter/ --collector.ntp --collector.ntp.server-is-local --collector.qdisc --no-collector.bcache --no-collector.bonding --no-collector.conntrack --no-collector.infiniband --no-collector.ipvs --no-collector.mdadm --no-collector.nfs --no-collector.nfsd --no-collector.powersupplyclass --no-collector.schedstat --no-collector.time --no-collector.uname --no-collector.xfs --no-collector.zfs --log.level=warn
### Are you running node_exporter in Docker?
No
### What did you do that produced an error?
Enabled collector.powersupplyclass (disabled above)
### What did you expect to see?
Valid output of battery status
### What did you see instead?
```
panic: label value "LNV-5B10W13894\xc0\xc0" is not valid UTF-8
goroutine 28 [running]:
github.com/prometheus/client_golang/prometheus.MustNewConstMetric(...)
/tmp/portage/app-metrics/node_exporter-1.1.1/homedir/go/pkg/mod/github.com/prometheus/client_golang@v1.9.0/prometheus/value.go:107
github.com/prometheus/node_exporter/collector.(*powerSupplyClassCollector).Update(0xc00035e5a0, 0xc00007f6e0, 0x10afc20, 0x0)
/tmp/portage/app-metrics/node_exporter-1.1.1/work/node_exporter-1.1.1/collector/powersupplyclass.go:166 +0x27f9
github.com/prometheus/node_exporter/collector.execute(0xbf759e, 0x10, 0xccec60, 0xc00035e5a0, 0xc00007f6e0, 0xcce520, 0xc0001219b0)
```
### Analysis
This is not strictly a bug in node_exporter, but since it crashes (due to the intentional panic in MustNewConstMetric) I figured I report it here anyway. Let me know if it's better suited for client_golang. It's not clear that anybody except the hardware is at fault here.
The problem is caused by garbage bytes returned by a sysfs entry and can be reduced to inspecting the `model_name` attribute of the battery in question:
```
$cat /sys/class/power_supply/BAT0/model_name
LNV-5B10W13894��
```
I traced this back into the drivers/acpi/battery driver and indeed the two extraneous `0xc0` bytes are returned by the hardware (see [here](https://git.kernel.org/pub/scm/linux/kernel/git/torvalds/linux.git/tree/drivers/acpi/battery.c#n295); battery is populated in line 204), so AFAICT it's not just random byte garbage due to an uninitilaized char[] or something like that. The two bytes are always the same.
My XFCE desktop environment can display the value correctly in xfce-power-manager, presumably because it normalizes the string value (probably by accident).
### Possible Mitigations
It's not clear how to 'best' fix this since this seems a problem with this particular battery model and/or my BIOS (1.16, updated a few days ago). I don't know whether it happened before.
My first idea was to sanitize all characters always and everywhere, but realized that would be overly drastic, regardless of whether they are sanitized in the kernel, in client_golang or node_exporter.
Instead I belive it makes more sense to be less strinct in client_golang when reading an attribute value in NewConstMetric() (called by MustNewConstMetric [here](https://github.com/prometheus/client_golang/blob/master/prometheus/value.go#L87)). If the "invalid UTF-8" exception can be avoided - possibly by catching it and simply ignoring the bogus characters - the (completely unnecessary) performance impact of unconditional sanitation would be mitigated. I don't know enough about Go character set conversions to tell whether that is feasible.
好像有人建议用“strings.ToValidUTF8来解决:
kqzh
2022 年8 月 22 日 11:13
8
看来不是配置方面的问题,可以贴下你使用的nebula版本吗,还有storaged的stats → 10.62.0.244:19779/stats
版本:nebula-graph-3.1.0.el7.x86_64.rpm
奇怪的是,这个版本我部署了两套环境(仿真和生产)。生产环境的没问题,这个问题只在仿真环境存在。
kqzh
2022 年8 月 29 日 06:48
11
可以提供一下storage endportIP: endpointPort/stats的数据吗 类似 10.62.0.244:19779/stats 我怀疑是exporter自动打的一些label值有问题
kqzh
2022 年8 月 29 日 07:02
13
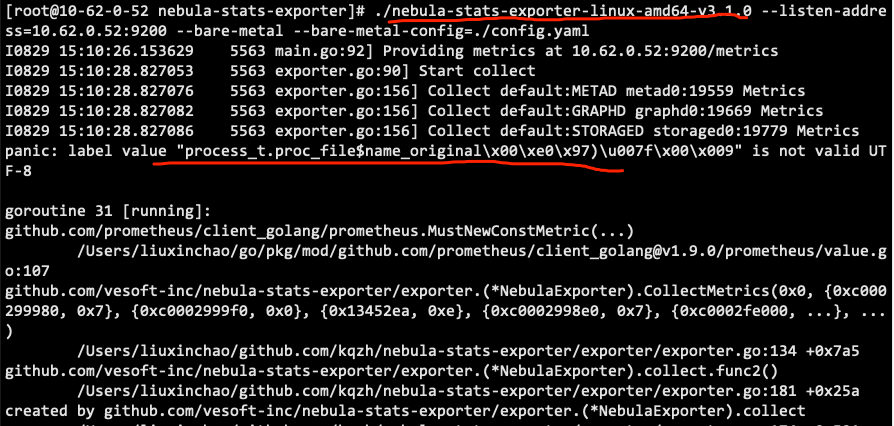
stats是正常的,可以升级下exporter看看,exporter目前是向下兼容的,可以直接用最新版本,nebula-stats-exporter-linux-amd64-v3.1.0
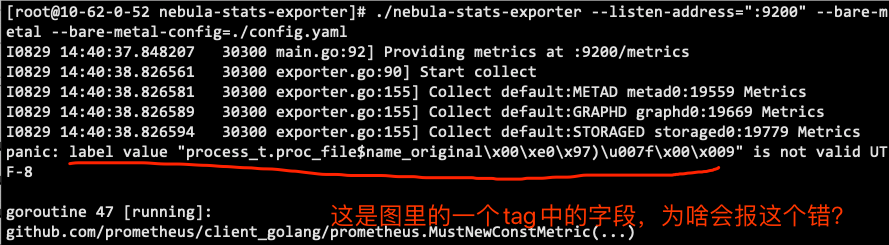
graphd的stat好像有问题。但是我看乱码的那些space ID,都不是我们添加的space。graphd_stat.txt (66.6 KB)
把Graphd上的”–enable_space_level_metrics“ 设置为false,stat-exporter就可以启动了; 之前是设置为true。
kqzh
2022 年8 月 29 日 07:30
18
了解,space后面跟的应该是space_name,看起来是字符集问题导致的,你可以先把graphd的config --enable_space_level_metrics 设为false,这样graphd就不会暴露space级别的指标,应该能暂时解决
kqzh
2022 年8 月 29 日 07:32
19
嗯嗯,是的,可以提供下集群现有的space吗,可以请 @jievince 看看
嗯,我现在就是这么干的。