是不是导完数据就会进行压缩,然后磁盘占比就会变小,但是我们的任务还没有结束就开始下降了。。
小姐姐,你看下上面 Nicole 的回复,按照她的说法试试,你没有新的有用信息给她,她没法进一步帮你解决问题的。Code of Conduct 论坛使用规范 (最后更新于 2021.06.17) 参考这个使用规范,不要浪费研发的回复资源,尽量提供有效的信息给回复者。
对应的违规行为参考这个帖子 论坛警告、禁言、封号规章制度公示(更新于 2021.07.16)
没有用啊 特别慢
会不会是我们现在是部署在一台机器上,伪分布式的三个节点,虽然SSD磁盘,但是并发还是带不起来,然后导数据特别慢?
点的exchange配置发一下,点和边的提交命令发一下
边:
{
  #park 相关配置
  spark: {
    app: {
      name: graph_rpt_spam_graph_uid_ip_registertime_ad_output_zongdawei
    }
    driver: {
      cores: 16
      maxResultSize: 0
    }
    cores {
      max: 128
    }
  }
  # Nebula Graph 相关配置
  nebula: {
    address:{
      # 以下为 Nebula Graph 的 Graph 服务和 Meta 服务所在机器的 IP 地址及端口
      # 如果有多个地址,格式为 "ip1:port","ip2:port","ip3:port"
      # 不同地址之间以英文逗号 (,) 隔开
      graph:["172.16.113.127:9669"]
      meta:["172.16.113.127:32845"]
    }

    # 填写的账号必须拥有 Nebula Graph 相应图空间的写数据权限
    user: root
    pswd: password
    # 填写 Nebula Graph 中需要写入数据的图空间名称
    space: ***Graph
    connection {
      timeout: 6000
      retry: 3
    }
    execution {
      retry: 3
    }
    error: {
      max: 32
      output: /tmp/errors
    }
    rate: {
      limit: 1024
      timeout: 5000
    }
  }
   edges:[
      {
      name: registerUserAndIP
      type: {
        source: hive
        sink: client
      }
      #exec: "select  t1.*  from  (select concat(uid,register_ip) as id, uid as id_source,register_ip as id_dst,registertime as registerTime  from  rpt.rpt_spam_graph_uid_ip_registertime_ad where day = '${one_day_ago}' and uid is not null and register_ip is not null and register_ip!='' ) as t1 left join (select concat(uid,register_ip) as id, uid as id_source,register_ip as id_dst,registertime as registerTime  from  rpt.rpt_spam_graph_uid_ip_registertime_ad where day = '${two_day_ago}' and uid is not null and register_ip is not null and register_ip!='' ) as t2 on t1.id  = t2.id where t2.id is null"
      exec: "select  id, id_source,id_dst,registerTime  from  tmp.zdw_tmp2021071904 "
      fields: [id,id_source ,id_dst,registerTime]
      nebula.fields: [id, id_source,id_dst, registerTime]
      source: id_source
      target: id_dst
      batch: 2000
      partition: 384
    }
  ]
}
节点:
{
  #park 相关配置
  spark: {
    app: {
      name: graph_rpt_spam_graph_uid_all_ip_ad_output_zongdawei
    }
    driver: {
      cores: 16
      maxResultSize: 0
    }
    cores {
      max: 128
    }
  }
  # Nebula Graph 相关配置
  nebula: {
    address:{
      # 以下为 Nebula Graph 的 Graph 服务和 Meta 服务所在机器的 IP 地址及端口
      # 如果有多个地址,格式为 "ip1:port","ip2:port","ip3:port"
      # 不同地址之间以英文逗号 (,) 隔开
      graph:["172.16.113.127:9669"]
      meta:["172.16.113.127:32845"]
    }

    # 填写的账号必须拥有 Nebula Graph 相应图空间的写数据权限
    user: root
    pswd: password
    # 填写 Nebula Graph 中需要写入数据的图空间名称
    space: SoulGraph
    connection {
      timeout: 6000
      retry: 3
    }
    execution {
      retry: 3
    }
    error: {
      max: 32
      output: /tmp/errors
    }
    rate: {
      limit: 1024
      timeout: 5000
    }
  }
  # 处理标签
  tags: [
         {
      name:IP
      type: {
        source: hive
        sink: client
      }

      # exec: "select t1.* from (select  distinct(ip)   from   rpt.rpt_spam_graph_uid_all_ip_ad  where day = '${one_day_ago}' and ip is not null  and ip !='') as t1 left join (   select  distinct(ip)   from   rpt.rpt_spam_graph_uid_all_ip_ad  where day = '${two_day_ago}' and ip is not null  and ip !='') as t2 on t1.ip = t2.ip  where  t2.ip is null"
      exec: "select  ip  from   tmp.zdw_tmp20210719"
      fields: [ip]
      nebula.fields: [ip]
      vertex: ip
      batch: 2000
      partition: 384
      isImplicit: true
    }
  ]
 }
命令:
spark-submit \
    --class com.vesoft.nebula.exchange.Exchange \
    --master yarn \
    --queue BO   \
    --name "zongdawei_graph" \
    --num-executors 128  \
    --executor-cores 1  \
    --executor-memory 8G \
    --driver-memory 4G \
    --conf spark.driver.host=$host_ip \
    --conf spark.network.timeout=240000 \
    /work/soul-bi-analyzer/dw_etl/tools/nebula-exchange-2.0.0.jar -c /tmp/rpt_spam_graph_uid_all_ip_ad_output"${one_day_ago}".conf -h
请大佬帮忙看下节点、边、命令都在了。数据导入特别慢,龟速。。。
请大佬帮忙看下。
当点和边的一条数据size一样时,边的导入速度也会比点慢,因为一条边底层会写正反两条数据。
你的边有4个属性,点有1个属性,边的速度比点慢是正常的。
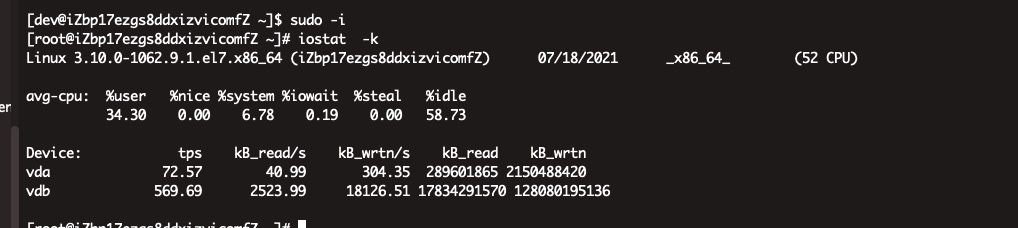
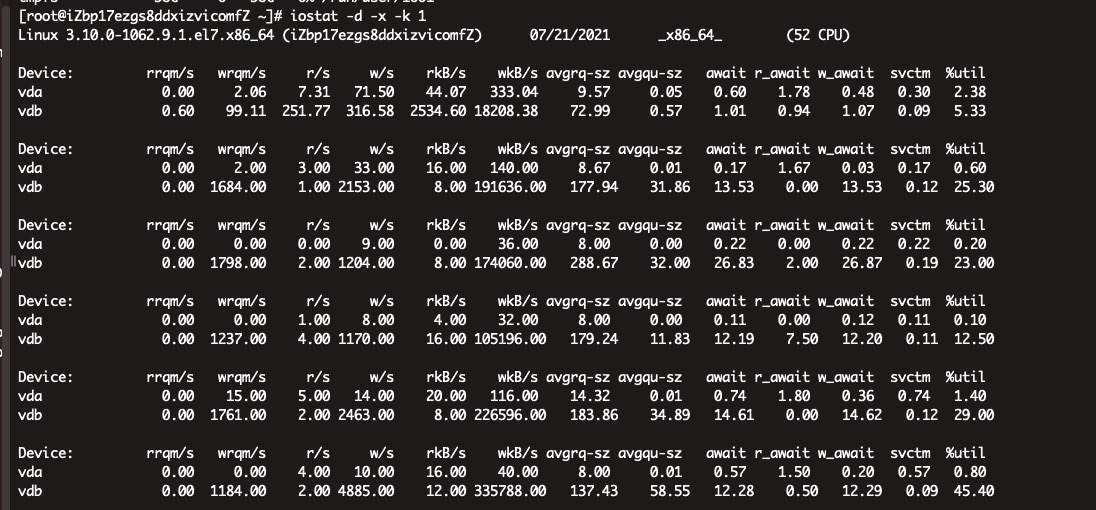
至于你说的龟速,你的导入并发度很高了,你再执行下导入,单后看下导入时的cpu使用率,网络io和磁盘io的使用率,看看导入瓶颈在哪里。
1 个赞
我们的瓶颈应该是在IO 因为只有一个节点,请问下应该怎么改服务器端的配置啊
你可以参考下 Nicole 在这个帖子上面的回复,去调试下对应的参数试试
是的瓶颈应该就在磁盘写了,按理这个速度也不会是你说的龟速啊。
看这个,io 写造成 ioutil 最高已经 45% 了。
你是不是开了自动 compact,然后数据规模,点和边的存储大小大概是多少,比如 100G 还是 200G。
如果导入的数据比较多,又开启了自动 compact,那可能大量 io 写都是因为 compact 造成的。
1 个赞
求指导 怎么才能关闭自动compact
另外自动压缩会对磁盘IO影响很大么
参考下文档 Compaction - Nebula Graph Database 手册
你的自动压缩是指 compact 么?因为 storage 底层是用了 rocksdb,当 compact 发生的时候,会做几个事情影响 io:
- 从硬盘中读数据,将重复数据合并,重组数据。
- 将重组后的数据回写磁盘。
然后 compact 的频率和你的数据大小有关系,还有 storage 的配置有关系。