记一次 nebula-storaged 内存占用高解决的过程

业务使用 Spark 对 Nebula (2.6.1) 进行数据导入时,发现系统内存持续增长,且不释放,具体情况如下图所示:

尝试解决

起手·配置文件

查看 Nebula 官网文档之后,对 nebula-storaged.conf 配置文件中的 --rocksdb_block_cache 进行调整,设置为 4M 大小,但是结果显示依旧同之前一样占用大量内存。继而继续调整配置项,设置 enable_partitioned_index_filter=true,问题依旧没有解决。

这里提一嘴 Nebula 的 RocksDB 实现,Nebula 底层存储引擎用的 Rocksdb,通过上面的参数设置 rocksdb_block_cache 对应 RocksDB block_cache 实例缓存未压缩块、enable_partitioned_index_filter 对应 pin_l0_filter_and_index_blocks_in_cache,在 Nebula 中只对 RocksDB 第 L0 层 SST 文件开启了索引(index block)和布隆过滤(filter block)缓存,在其他层不进行缓存。

配置完 enable_partitioned_index_filter=true 理论上存储不会占用很多内存,但是内存占用量仍旧持续不减,猜想可能是某个进程占用了内存,可以通过剖析工具去定位哪里占用了内存。

验证猜想

在网上找到相关资料后,用内存分配器 jemollc 自带的 jeprof 工具收集内存分配信息,生成 jeprof.*heap 文件进行内存占用量分析。参考以下命令:

MALLOC_CONF="prof:true,lg_prof_interval:26" LD_PRELOAD="/usr/lib64/libjemalloc.so.2" /usr/local/nebula/bin/nebula-storaged --flagfile /usr/local/nebula/etc/nebula-storaged.conf

再通过 jeprof 读取生成的 jeprof.*heap 文件:

jeprof /usr/local/nebula/bin/nebula-storaged jeprof.*
(jeprof) top
Total: 18903464.5 MB
13371403.1  70.7%  70.7% 13371403.1  70.7% rocksdb::UncompressBlockContentsForCompressionType
5503821.4  29.1%  99.9% 18875224.5  99.9% rocksdb::BlockFetcher::ReadBlockContents
  5923.5   0.0%  99.9%   6518.4   0.0% rocksdb::LRUCacheShard::Insert
  4704.0   0.0%  99.9%   4704.0   0.0% std::__cxx11::basic_string::_M_mutate
  3257.7   0.0%  99.9%  10664.1   0.1% rocksdb::BlockBasedTable::PutDataBlockToCache
  2964.1   0.0%  99.9%   3261.7   0.0% std::__detail::_Map_base::operator[]
  2085.1   0.0% 100.0%   2085.1   0.0% rocksdb::VersionBuilder::Rep::ApplyFileAddition
  1714.6   0.0% 100.0%   1714.6   0.0% std::_Rb_tree::_M_insert_unique
  1483.0   0.0% 100.0%   1783.5   0.0% nebula::meta::MetaClient::loadSessions

这里我们看到上面 RocksDB 报了个 UncompressBlockContentsForCompressionType,将该提示符去 Rock s DB 的 GitHub 检索下,看能发现什么?在 GitHub 的 issue:https://github.com/facebook/rocksdb/issues/4112 中有用户通过设置参数 max_open_files 为 20 降低了内存。所以我们也来试试。

然而设置完 max_open_files 为 20 之后,内存占用依旧高。继续用 jeprof 来分析下内存占用;

这里提下 jeprof 生成的内存 profile 支持 PDF、SVG 等多种格式。由于 jeprof 生成的 PDF 可看到调用链,因此这里我采用了 PDF 格式。

jeprof --pdf /usr/local/nebula/bin/nebula-storaged jeprof.* > nebula-storaged.pdf

从生成的 PDF 中,我发现是 PartitionIndexReader、PartitionedFilterBlockReader 进程占用内存高:
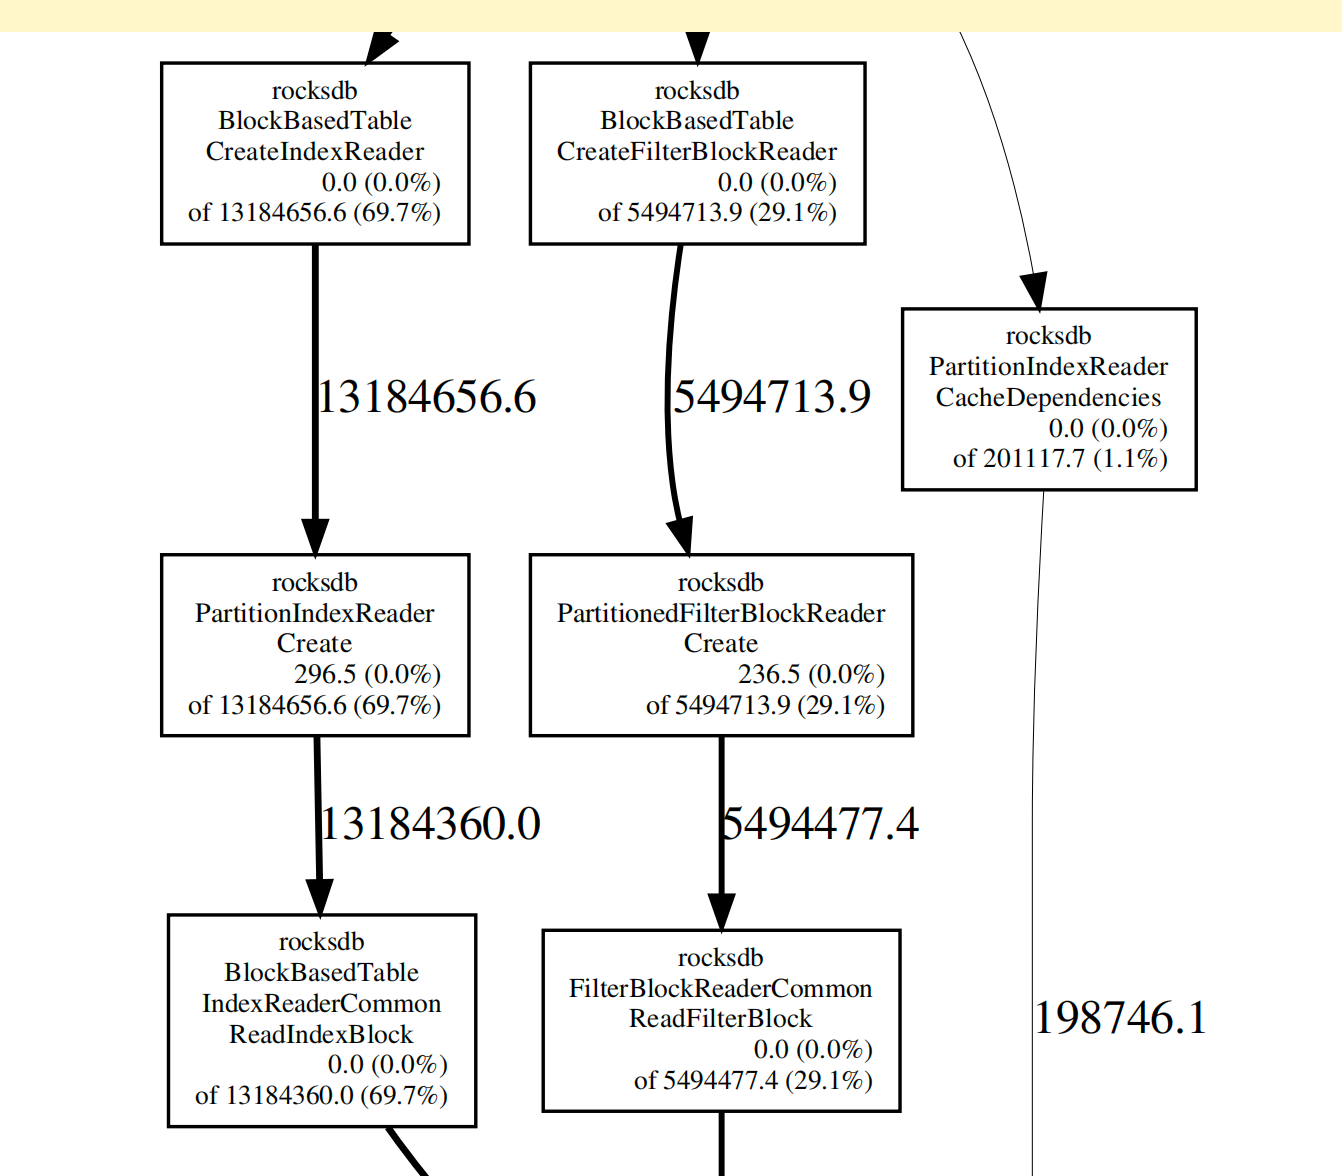
具体的 PDF 可查看附件:

nebula.pdf (15.3 KB)

最后一击

这里要搬出程序员的背后大佬——搜索引擎了,通过谷歌检索 rocksdb PartitionIndexReader high memory,好的,找到了一个相关连接:http://rocksdb.org/blog/2017/05/12/partitioned-index-filter.html

来看看这个 url 里面有什么——"cache_index_and_filter_blocks,通过设置cache_index_and_filter_blocks:false,再重启 nebula-storage 进程,内存终于降下去了

查看 RocksDB 官网:https://github.com/facebook/rocksdb/wiki/Memory-usage-in-RocksDB 这块对 “RocksDB memory used” 内容的讲解:如果你设置 cache_index_and_filter_blockstrue,索引和过滤块会被存储在块缓存,跟其他数据块一起;如果设置成 cache_index_and_filter_blocks:false,此时 index 和 filter 这边内存占用量并会释放(因为不占用内存)。

但设置 cache_index_and_filter_blocks:false 会降低性能,这里在开启缓存之后,尝试调整参数找到性能平衡点:通过调大 block_size,增加块大小,降低块的数量,故而线性减少索引的大小。

尝试调大 block_size 到 32768,降低 max_open_files 到 50000,重启 nebula-storage:很好,内存使用率保持在比较低的水平。

这里要提醒下各位不要设置 max_open_files 参数设为 -1,在 max_open_files=-1 设定下其他参数做任何调整都不起作用。

还有一个优化内存的点:可修改布隆过滤器为 Ribbon Filter,可优化内存。但该修改会增高 CPU 消耗,这里并没有进行相关调整,仅配置做了这两个参数的调整:max_open_files:50000block_size:32768。修改如下:

--rocksdb_db_options={"max_subcompactions":"4","max_background_jobs":"4","max_open_files":"50000"}
--rocksdb_block_based_table_options={"block_size":"32768","cache_index_and_filter_blocks":"true"}

至此,问题解决。

参考文献:

8 个赞

太强了 :+1:

最后一击的段落里,有两处cache_index_and_filter_blocks:false的地方是笔误吗 :thinking:

cache_index_and_filter_blocks 设成这样,主要是证明这块是内存的消耗点,如果设成false会有性能问题

There are two options that configure how much index and filter blocks we fit in memory:

If you set cache_index_and_filter_blocks to true, index and filter blocks will be stored in block cache, together with all other data blocks. This also means they can be paged out. If your access pattern is very local (i.e. you have some very cold key ranges), this setting might make sense. However, in most cases it will hurt your performance, since you need to have index and filter to access a certain file. An exception to cache_index_and_filter_blocks=true is for L0 when setting pin_l0_filter_and_index_blocks_in_cache=true, which can be a good compromise setting.

If cache_index_and_filter_blocks is false (which is default), the number of index/filter blocks is controlled by option max_open_files. If you are certain that your ulimit will always be bigger than number of files in the database, we recommend setting max_open_files to -1, which means infinity. This option will preload all filter and index blocks and will not need to maintain LRU of files. Setting max_open_files to -1 will get you the best possible performance.

从这个来看,似乎是cache_index_and_filter_blocks为true时,索引块也放在数据块缓存里,所以会有page out以及读数据时索引块缓存miss增加磁盘io的风险,所以会影响性能。

如果设置为false,那么索引块就单独保存,单独有一个lru,并且lru的大小由max_open_files来指定。如果这个配置设为-1,那么就会预加载所有索引快并且不需要维护lru缓存。缺点就是会增加内存。

这么来看cache_index_and_filter_blocks=true时,似乎配置项max_open_files就没用了。 :thinking:

所以不确定是不是Bug ,官方给的enable_partitioned_index_filter 只缓存L0层的数据,应该就可以了,但确实是存在内存使用高的问题

看起来cache_index_and_filter_blocks和enable_partitioned_index_filter同时设置为true能缓解内存使用过高问题的同时相对保持性能。一个配置项是减少索引块的内存占用,缺点是会增加磁盘io读的数量;一个配置项是只读L0层的数据,减少读的体量。不过性能有点降低是肯定的,这个只能说看实际需求。 :joy:两全其美的方法估计就只有加内存了。

1 个赞

enable_partitioned_index_filter (Rocksdb pin_l0_filter_and_index_blocks_in_cache)但这个参数并没解决问题

按我理解,上面可能说的不太准:

  • cache_index_and_filter_blocks为true,rocksdb的index/filter会和正常的数据一起去抢block cache,所以性能会有损耗
  • cache_index_and_filter_blocks为false,不是不占内存,只是不占block cache。这种情况下index/filter占用的内存是在block cache之外的,也就是每打开一个sst文件,它里面的index/filter就会load进内存。(这才是为什么调整block_sizemax_open_files能够解决你说的问题的原因)
4 个赞

不过话说回来,我还没见到过cache_index_and_filter_blocks为true的情况下,启动内存仍然非常大的情况。有几个东西你可以确认下:

  1. sst数量
  2. 单个sst里面index/filter的大小(可以随便找几个sst 然后用rocksdb的sst_dump工具查看)
  3. sst在各层的分布
2 个赞

好的,我看下

** Compaction Stats [default] **
Level    Files   Size     Score Read(GB)  Rn(GB) Rnp1(GB) Write(GB) Wnew(GB) Moved(GB) W-Amp Rd(MB/s) Wr(MB/s) Comp(sec) CompMergeCPU(sec) Comp(cnt) Avg(sec) KeyIn KeyDrop
----------------------------------------------------------------------------------------------------------------------------------------------------------------------------
  L0      2/0    2.05 KB   0.5      0.0     0.0      0.0       0.0      0.0       0.0   1.0      0.0      1.5      0.00              0.00         1    0.001       0      0
  L1      6/0   243.60 MB   1.0      0.0     0.0      0.0       0.0      0.0       0.0   0.0      0.0      0.0      0.00              0.00         0    0.000       0      0
  L2     50/0    2.48 GB   1.0      0.0     0.0      0.0       0.0      0.0       0.0   0.0      0.0      0.0      0.00              0.00         0    0.000       0      0
  L3    416/0   24.97 GB   1.0      0.0     0.0      0.0       0.0      0.0       0.0   0.0      0.0      0.0      0.00              0.00         0    0.000       0      0
  L4   1000/0   60.57 GB   0.2      0.0     0.0      0.0       0.0      0.0       0.0   0.0      0.0      0.0      0.00              0.00         0    0.000       0      0
 Sum   1474/0   88.25 GB   0.0      0.0     0.0      0.0       0.0      0.0       0.0   1.0      0.0      1.5      0.00              0.00         1    0.001       0      0
 Int      0/0    0.00 KB   0.0      0.0     0.0      0.0       0.0      0.0       0.0   0.0      0.0      0.0      0.00              0.00         0    0.000       0      0

1 个赞

谢谢,你说的是对的,谢谢老师指正错误

Process /data/nebula/data/storage/nebula/3/data/276924.sst
Sst file format: block-based
from [] to []
Table Properties:
------------------------------
  # data blocks: 148152
  # entries: 921192
  # deletions: 0
  # merge operands: 0
  # range deletions: 0
  raw key size: 5550181800
  raw average key size: 6025.000000
  raw value size: 24862198
  raw average value size: 26.989160
  data block size: 67109354
  index block size (user-key? 1, delta-value? 1): 253536473
  # index partitions: 27700
  top-level index size: 83699470
  filter block size: 0
  (estimated) table size: 320645827
  filter policy name: rocksdb.BuiltinBloomFilter
  prefix extractor name: nullptr
  column family ID: 0
  column family name: default
  comparator name: leveldb.BytewiseComparator
  merge operator name: nullptr
  property collectors names: []
  SST file compression algo: LZ4
  SST file compression options: window_bits=-14; level=32767; strategy=0; max_dict_bytes=0; zstd_max_train_bytes=0; enabled=0;
  creation time: 1647261423
  time stamp of earliest key: 0
  file creation time: 1647829598
  DB identity: 9c8dda9b-4572-4b01-b6a0-ae2f800f7c3c
  DB session identity: 4VZKQ83CS1EQUAAGO0VT
  Raw user collected properties
------------------------------
  # rocksdb.block.based.table.index.type: 0x02000000
  # rocksdb.block.based.table.prefix.filtering: 0x30
  # rocksdb.block.based.table.whole.key.filtering: 0x30
  # rocksdb.deleted.keys: 0x00
  # rocksdb.merge.operands: 0x00

呃呃呃,有几个问题啊:

  1. 这个大小好夸张啊,data block size(这个是数据块)大概64M,index的大小怎么会接近256M了 :joy:
    业务上存的key非常大或者非常小?

index block size (user-key? 1, delta-value? 1): 253536473

  1. 单个sst的大小是接近320M吗?

(estimated) table size: 320645827

  1. 从输出结果上看,应该是开了cache_index_and_filter_blocks对吧

rocksdb.block.based.table.index.type: 0x02000000

哦 我看到了 你们key/value大小都很大啊 我回头得确认下 是不是跟这个有关

1 个赞

附上一个很久以前做测试时候留下的sst dump的结果,同样是64M的数据我这index就100K不到

  raw key size: 88510215
  raw average key size: 58.089995
  raw value size: 93012937
  raw average value size: 61.045169
  data block size: 67111991
  index block size (user-key? 1, delta-value? 1): 752832

老师sst文件 68M,是开了cache_index_and_filter_blocks

这个sst里有50多亿的key? 然后value只有两千多万。
是不是Nebula里建了很多索引呢?

老师,这个我确认下,查了没索引