- nebula 版本:2.6.1
- 部署方式:分布式
- 安装方式:源码编译
- 是否为线上版本:Y
- 硬件信息
- CPU、内存信息: 服务端共部署了5台机器,每台机器的配置是16c 128g。
- 客户端信息: 我们部署了10个客户端,每个客户端的参数是这样设置的:
“timeout”: 5000,
“idle_time”: 5000,
“max_conn_pool_size”: 80,
“min_conn_pool_size”: 40
- 问题的具体描述
我在使用golang客户端github.com/vesoft-inc/nebula-go/v2 v2.6.0的时候,建立了连接池。
然后每次请求会使用getSession方法获取一个session,然后用这个session去执行查询,然后释放掉session。但是遇到了查询瓶颈。
查询语句是
USE account_graph;MATCH (v:aid{account_id:'123456789'}) RETURN v
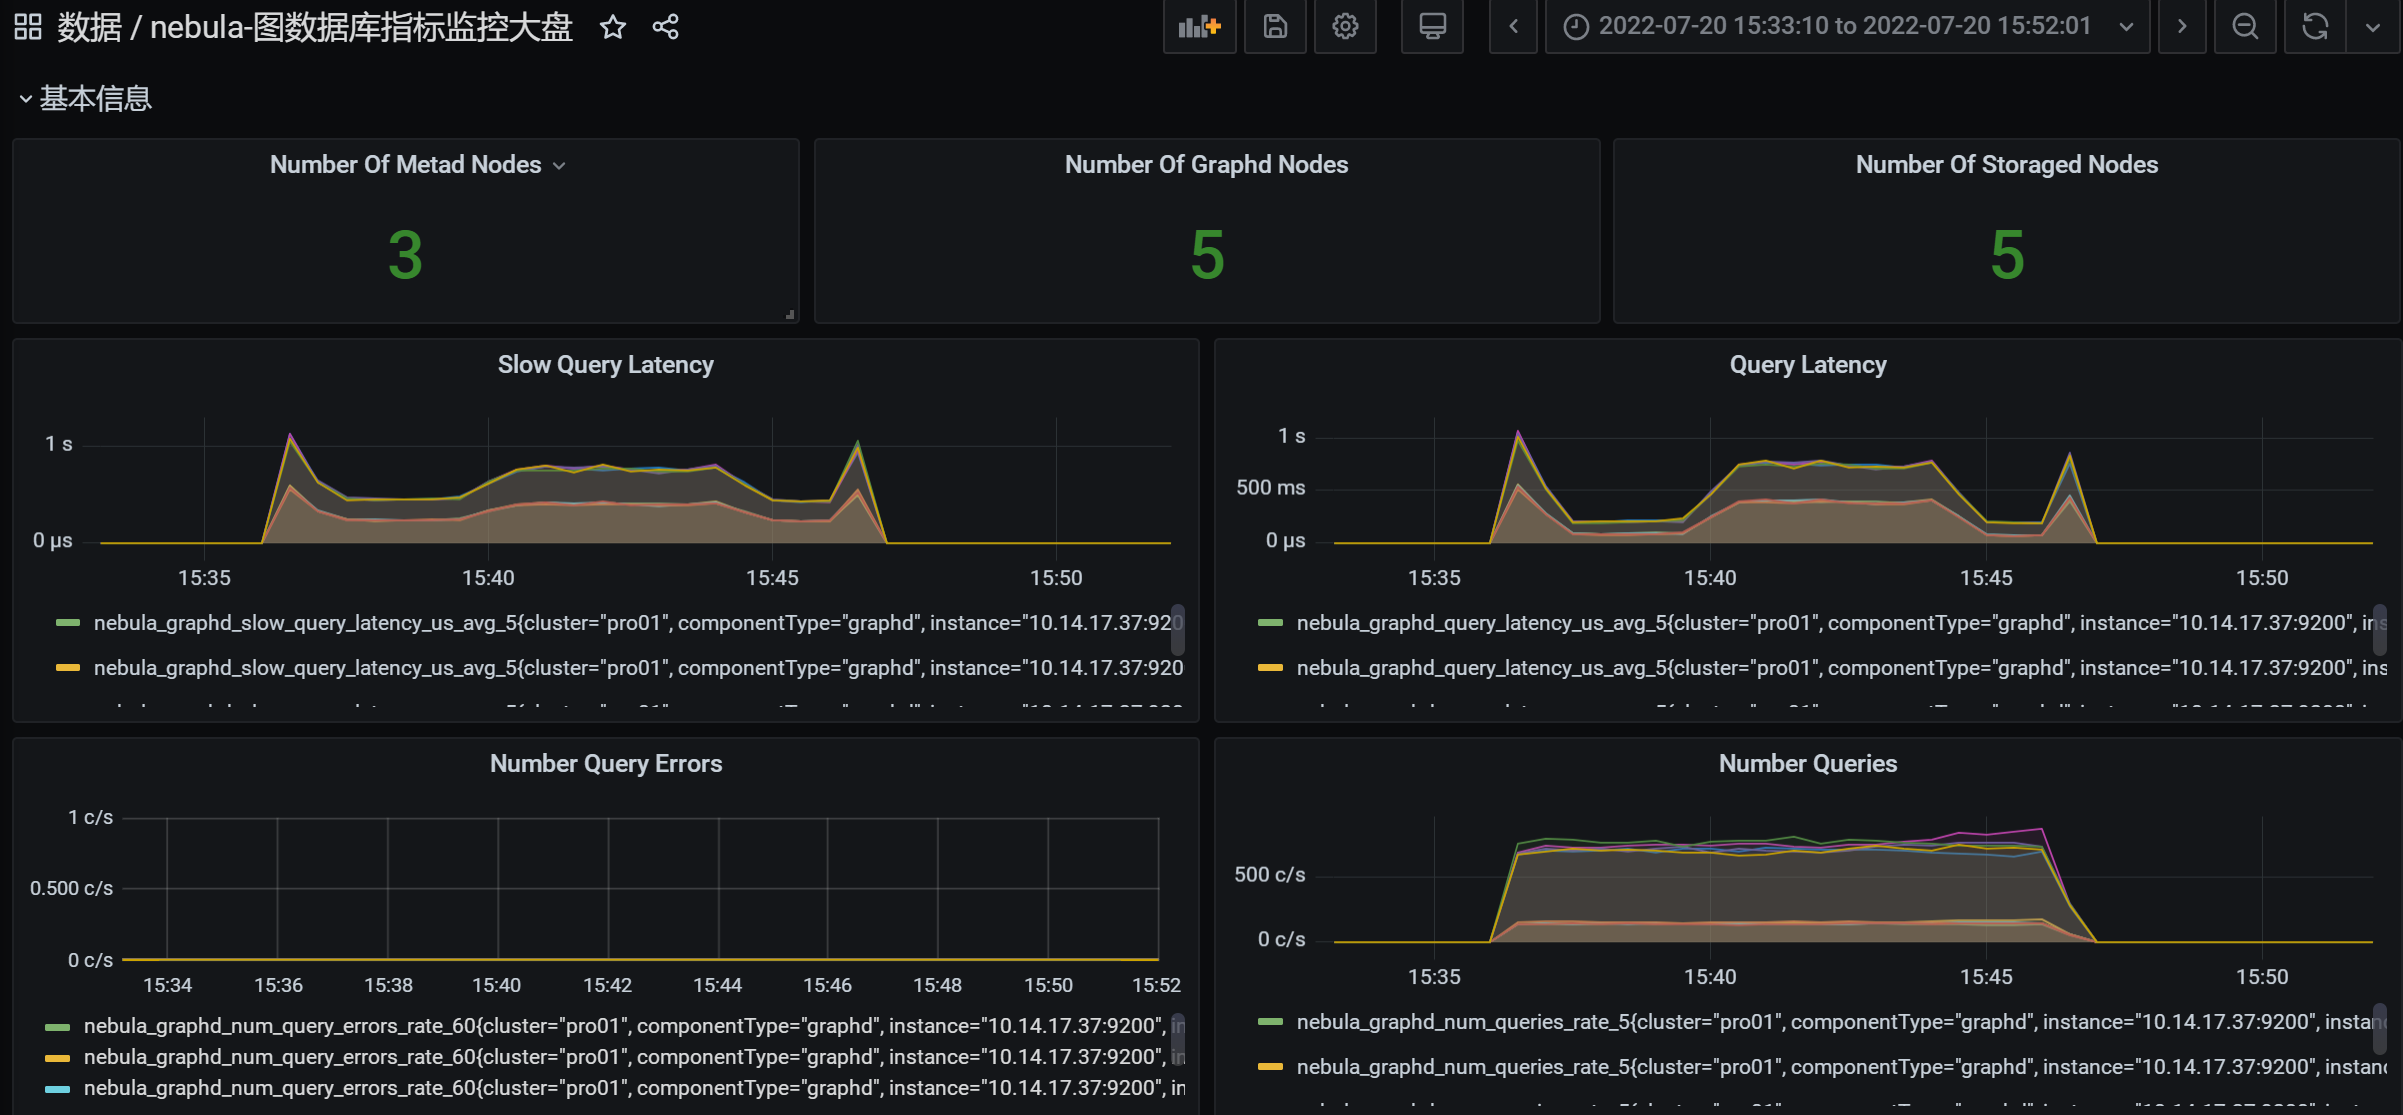
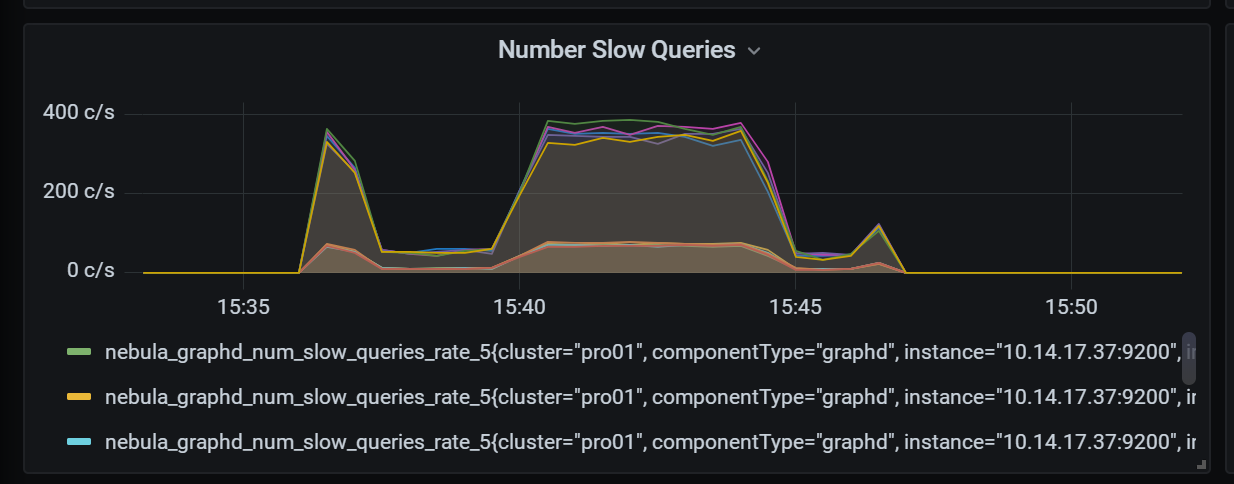
数据量是3亿个vertex,我单次查询只需要十多毫秒,但是并发场景下,遇到了查询耗时的问题。
下图是以 200QPS 并发查询,出现了大量耗时很久的情况,而且遇到了连接池达到上限的错误。
看上去是连接已经耗尽,不知道是查询慢导致的请求堆积,还是什么其他原因。一些简单的DescribeTag也很慢。
但我们看CPU和内存,都没遇到瓶颈。
此外,我们的目标是查询支持1000QPS,延迟在50ms内。
// InitNebulaDB init nebula DB instance
func InitNebulaDB(ctx context.Context) {
	NebulaDBInstance.setupPool(ctx, config.GlobalConfig.ServiceConfig)
}

// setupPool 初始化连接池
func (n *NebulaDB) setupPool(ctx context.Context, serviceConf *config.ServiceConfig) {
	nebulaConfig := serviceConf.Nebula
	log.Infof(ctx, fmt.Sprintf("nebula config:%v", nebulaConfig))
	// address 和 port 决定一个连接池
	var addresses []nebula.HostAddress
	for _, hostAddress := range nebulaConfig.HostAddressList {
		addresses = append(addresses, nebula.HostAddress{
			Host: hostAddress.Host,
			Port: hostAddress.Port,
		})
	}

	// Create configs for connection ConnPool
	poolConfig := nebula.PoolConfig{
		TimeOut:         time.Duration(nebulaConfig.Timeout) * time.Millisecond,
		IdleTime:        time.Duration(nebulaConfig.IdleTime) * time.Millisecond,
		MaxConnPoolSize: nebulaConfig.MaxConnPoolSize,
		MinConnPoolSize: nebulaConfig.MinConnPoolSize,
	}
	var logger = NewNebulaLogger(ctx)
	// Initialize ConnectionPool
	pool, err := nebula.NewConnectionPool(addresses, poolConfig, logger)
	if err != nil {
		log.Errorf(ctx, fmt.Sprintf("Fail to initialize the ConnectionPool, "+
			"HostAddressList: %+v, err: %s", nebulaConfig.HostAddressList, err.Error()))
	}
	n.ConnPool = pool
}

func (n *NebulaDB) getSession(ctx context.Context, serviceConf *config.ServiceConfig, operationType metric.OperationTypeEnum) (*nebula.Session, error) {
	nebulaConfig := serviceConf.Nebula
	username := nebulaConfig.Username
	password := nebulaConfig.Password

	return n.ConnPool.GetSession(username, password)
}

func (n *NebulaDB) ExecuteJSON(ctx context.Context, stmt string,
	operationType metric.OperationTypeEnum) ([]byte, error) {
	session, err := n.getSession(ctx, config.GlobalConfig.ServiceConfig, operationType)
	if err != nil {
		return nil, err
	}
	defer func() {
		// Release session and return connection back to connection ConnPool
		session.Release()
	}()

	return session.ExecuteJson(stmt)
}

[图片]
[图片]
服务端配置如下
Meta
########## basics ##########
# 是否启动守护进程
--daemonize=true
# 记录进程ID的文件。
--pid_file=pids/nebula-metad.pid
# 系统默认值为 UTC+00:00:00
--timezone_name=UTC+08:00

########## logging ##########
# The directory to host logging files
# 存放Meta服务日志的目录,建议和数据保存在不同硬盘。
--log_dir=logs
# 最小日志级别 Log level, 0, 1, 2, 3 for INFO, WARNING, ERROR, FATAL respectively
--minloglevel=0
# 日志详细级别,值越大,日志记录越详细 Verbose log level, 1, 2, 3, 4, the higher of the level, the more verbose of the logging
--v=0
# 缓冲日志的最大时间,超时后输出到日志文件。 0 表示实时输出。单位:秒。 Maximum seconds to buffer the log messages
--logbufsecs=0
# 是否将标准输出和标准错误重定向到单独的输出文件。
--redirect_stdout=true
# Destination filename of stdout and stderr, which will also reside in log_dir.
--stdout_log_file=metad-stdout.log
--stderr_log_file=metad-stderr.log
# 要复制到标准错误中的最小日志级别( minloglevel)The numbers of severity levels INFO, WARNING, ERROR, and FATAL are 0, 1, 2, and 3, respectively.
--stderrthreshold=2

########## networking ##########
# 全部Meta服务的IP地址和端口。多个Meta服务用英文逗号(,)分隔
--meta_server_addrs=192.168.2.1:9559
# Meta服务的本地IP地址
--local_ip=192.168.2.1
# Meta服务的RPC守护进程监听端口。Meta服务对外端口为 9559 ,对内端口为 对外端口+1 ,即 9560 ,Nebula Graph使用内部端口进行多副本间的交互
--port=9559
# HTTP service ip
--ws_ip=0.0.0.0
# HTTP service port
--ws_http_port=19559
# HTTP2 service port
--ws_h2_port=19560
# HTTP协议监听Storage服务的端口,需要和Storage服务配置文件中的 ws_http_port 保持一致
--ws_storage_http_port=19779

########## storage ##########
# meta数据存储路径
--data_path=data/meta

########## Misc #########
# 创建图空间时的默认分片数量
--default_parts_num=20
# 创建图空间时的默认副本数量
--default_replica_factor=1

# 默认心跳间隔。请确保所有服务的 heartbeat_interval_secs 取值相同,否则会导致系统无法正常工作。单位:秒
--heartbeat_interval_secs=10

############## rocksdb Options ##############
# 是否同步写RocksDB的WAL日志
--rocksdb_wal_sync=true
Graph
########## basics ##########
# Whether to run as a daemon process
--daemonize=true
# The file to host the process id
--pid_file=pids/nebula-graphd.pid
# Whether to enable optimizer
--enable_optimizer=true
# 系统默认值为 UTC+00:00:00
--timezone_name=UTC+08:00
# Heartbeat interval of communication between meta client and graphd service
--heartbeat_interval_secs=10
# 是否从配置文件获取配置信息
--local_config=true

########## logging ##########
# The directory to host logging files
--log_dir=logs
# Log level, 0, 1, 2, 3 for INFO, WARNING, ERROR, FATAL respectively
--minloglevel=0
# Verbose log level, 1, 2, 3, 4, the higher of the level, the more verbose of the logging
--v=0
# Maximum seconds to buffer the log messages
--logbufsecs=0
# Whether to redirect stdout and stderr to separate output files
--redirect_stdout=true
# Destination filename of stdout and stderr, which will also reside in log_dir.
--stdout_log_file=graphd-stdout.log
--stderr_log_file=graphd-stderr.log
# Copy log messages at or above this level to stderr in addition to logfiles. The numbers of severity levels INFO, WARNING, ERROR, and FATAL are 0, 1, 2, and 3, respectively.
--stderrthreshold=2

########## query ##########
# Whether to treat partial success as an error.
# This flag is only used for Read-only access, and Modify access always treats partial success as an error.
--accept_partial_success=false
# Maximum sentence length, unit byte
--max_allowed_query_size=4194304

########## networking ##########
# Comma separated Meta Server Addresses
--meta_server_addrs=127.0.0.1:9559
# Local IP used to identify the nebula-graphd process.
# Change it to an address other than loopback if the service is distributed or
# will be accessed remotely.
--local_ip=127.0.0.1
# Network device to listen on
--listen_netdev=any
# Port to listen on
--port=9669
# To turn on SO_REUSEPORT or not
--reuse_port=false
# socket监听的连接队列最大长度, adjust this together with net.core.somaxconn
--listen_backlog=1024
# Seconds before the idle connections are closed, 0 for never closed
--client_idle_timeout_secs=14400
# Seconds before the idle sessions are expired, 0 for no expiration
--session_idle_timeout_secs=7200
# The number of threads to accept incoming connections
--num_accept_threads=4
# The number of networking IO threads, 0 for # of CPU cores
--num_netio_threads=32
# The number of threads to execute user queries, 0 for # of CPU cores
--num_worker_threads=32
# HTTP service ip
--ws_ip=0.0.0.0
# HTTP service port
--ws_http_port=19669
# HTTP2 service port
--ws_h2_port=19670
# Graph服务与Storage服务的RPC连接超时时间
--storage_client_timeout_ms=60000
# Port to listen on Meta with HTTP protocol, it corresponds to ws_http_port in metad's configuration file
--ws_meta_http_port=19559

########## authentication ##########
# Enable authorization
--enable_authorize=true
# User login authentication type, password for nebula authentication, ldap for ldap authentication, cloud for cloud authentication
--auth_type=password

########## memory ##########
# System memory high watermark ratio
--system_memory_high_watermark_ratio=0.75

########## experimental feature ##########
# if use experimental features
--enable_experimental_feature=false
Storage
########## basics ##########
# Whether to run as a daemon process
--daemonize=true
# The file to host the process id
--pid_file=pids/nebula-storaged.pid
# 系统默认值为 UTC+00:00:00
--timezone_name=UTC+08:00
# Whether to use the configuration obtained from the configuration file
--local_config=true

########## logging ##########
# The directory to host logging files
--log_dir=logs
# Log level, 0, 1, 2, 3 for INFO, WARNING, ERROR, FATAL respectively
--minloglevel=0
# Verbose log level, 1, 2, 3, 4, the higher of the level, the more verbose of the logging
--v=0
# Maximum seconds to buffer the log messages
--logbufsecs=0
# Whether to redirect stdout and stderr to separate output files
--redirect_stdout=true
# Destination filename of stdout and stderr, which will also reside in log_dir.
--stdout_log_file=storaged-stdout.log
--stderr_log_file=storaged-stderr.log
# Copy log messages at or above this level to stderr in addition to logfiles. The numbers of severity levels INFO, WARNING, ERROR, and FATAL are 0, 1, 2, and 3, respectively.
--stderrthreshold=2

########## networking ##########
# Comma separated Meta server addresses
--meta_server_addrs=192.168.2.1:9559
# Local IP used to identify the nebula-storaged process.
# Change it to an address other than loopback if the service is distributed or
# will be accessed remotely.
--local_ip=192.168.2.3
# Storage daemon listening port
--port=9779
# HTTP service ip
--ws_ip=0.0.0.0
# HTTP service port
--ws_http_port=19779
# HTTP2 service port
--ws_h2_port=19780
# heartbeat with meta service
--heartbeat_interval_secs=10

######### Raft #########
# Raft election timeout
--raft_heartbeat_interval_secs=30
# RPC timeout for raft client (ms)
--raft_rpc_timeout_ms=500
## recycle Raft WAL
--wal_ttl=14400

########## Disk ##########
# Root data path. split by comma. e.g. --data_path=/disk1/path1/,/disk2/path2/
# One path per Rocksdb instance.
--data_path=data/storage

# 每个数据存储路径的剩余空间最小值,低于该值时,可能会导致集群数据写入失败。单位:字节。默认为 1073741824 ,即1GB。
--minimum_reserved_bytes=1073741824

# The default reserved bytes for one batch operation
--rocksdb_batch_size=4096
# The default block cache size used in BlockBasedTable. (MB)
# recommend: 1/3 of all memory
--rocksdb_block_cache=4096

# Compression algorithm, options: no,snappy,lz4,lz4hc,zlib,bzip2,zstd
# For the sake of binary compatibility, the default value is snappy.
# Recommend to use:
#   * lz4 to gain more CPU performance, with the same compression ratio with snappy
#   * zstd to occupy less disk space
#   * lz4hc for the read-heavy write-light scenario
--rocksdb_compression=lz4

# Set different compressions for different levels
# For example, if --rocksdb_compression is snappy,
# "no:no:lz4:lz4::zstd" is identical to "no:no:lz4:lz4:snappy:zstd:snappy"
# In order to disable compression for level 0/1, set it to "no:no"
--rocksdb_compression_per_level=

############## rocksdb Options ##############
# rocksdb DBOptions in json, each name and value of option is a string, given as "option_name":"option_value" separated by comma
--rocksdb_db_options={"max_subcompactions":"4","max_background_jobs":"4"}
# rocksdb ColumnFamilyOptions in json, each name and value of option is string, given as "option_name":"option_value" separated by comma
--rocksdb_column_family_options={"disable_auto_compactions":"false","write_buffer_size":"67108864","max_write_buffer_number":"4","max_bytes_for_level_base":"268435456"}
# rocksdb BlockBasedTableOptions in json, each name and value of option is string, given as "option_name":"option_value" separated by comma
--rocksdb_block_based_table_options={"block_size":"8192"}

# Whether or not to enable rocksdb's statistics, disabled by default
--enable_rocksdb_statistics=false

# Statslevel used by rocksdb to collection statistics, optional values are
#   * kExceptHistogramOrTimers, disable timer stats, and skip histogram stats
#   * kExceptTimers, Skip timer stats
#   * kExceptDetailedTimers, Collect all stats except time inside mutex lock AND time spent on compression.
#   * kExceptTimeForMutex, Collect all stats except the counters requiring to get time inside the mutex lock.
#   * kAll, Collect all stats
--rocksdb_stats_level=kExceptHistogramOrTimers

# 是否启用prefix bloom filter,启用时可以提升图遍历速度,但是会增加内存消耗
--enable_rocksdb_prefix_filtering=true
# 是否启用whole key bloom filter
--enable_rocksdb_whole_key_filtering=false

############### misc ####################
# Raft leader向Raft group中其它成员同步存量数据时的限速。单位:字节/秒
--snapshot_part_rate_limit=8388608
# Raft leader向Raft group中其它成员同步存量数据时每批发送的数据量。单位:字节
--snapshot_batch_size=1048576
# 重建索引过程中,Raft leader向Raft group中其它成员同步索引数据时的限速。单位:字节/秒。
--rebuild_index_part_rate_limit=4194304
# 重建索引过程中,Raft leader向Raft group中其它成员同步索引数据时每批发送的数据量。单位:字节。
--rebuild_index_batch_size=1048576

# 每个稠密点,最多返回多少条边,多余的边截断不返回 防止超级节点拖垮服务
--max_edge_returned_per_vertex=10000